13 - Create a Report
Last updated 2/01/2024
This documentation will explain how to create a basic report from a data source.Navigate to Reports
1. Click Visual in the menu.2. Click Reports in the sub-menu.
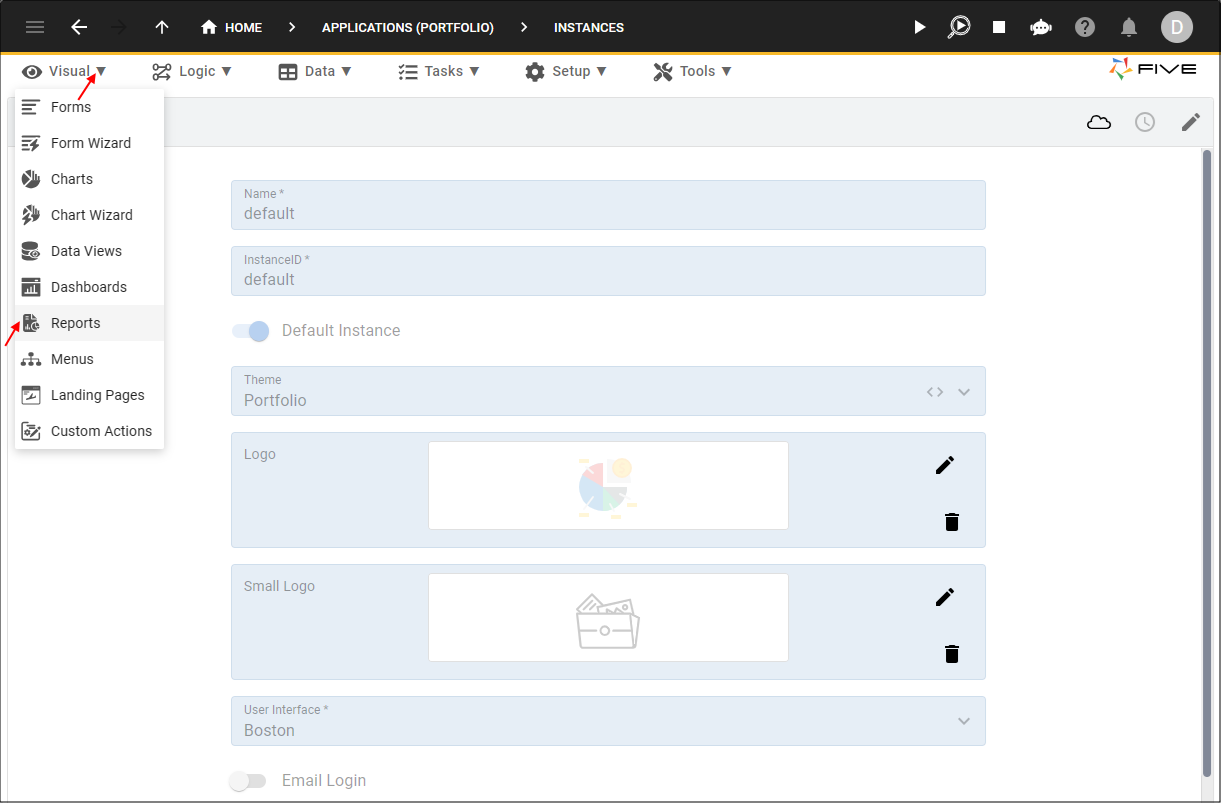
Figure 1 - Reports menu item
Add the Daily Volume Report
1. Click the Add Item button.2. Type Daily Volume Report in the Title field.

Figure 2 - Add the Daily Volume Report
info
We will need to add the DailyVolumeQuery as our data source so we can select the fields from the query in our template.
3. Click the Data Sources tab.
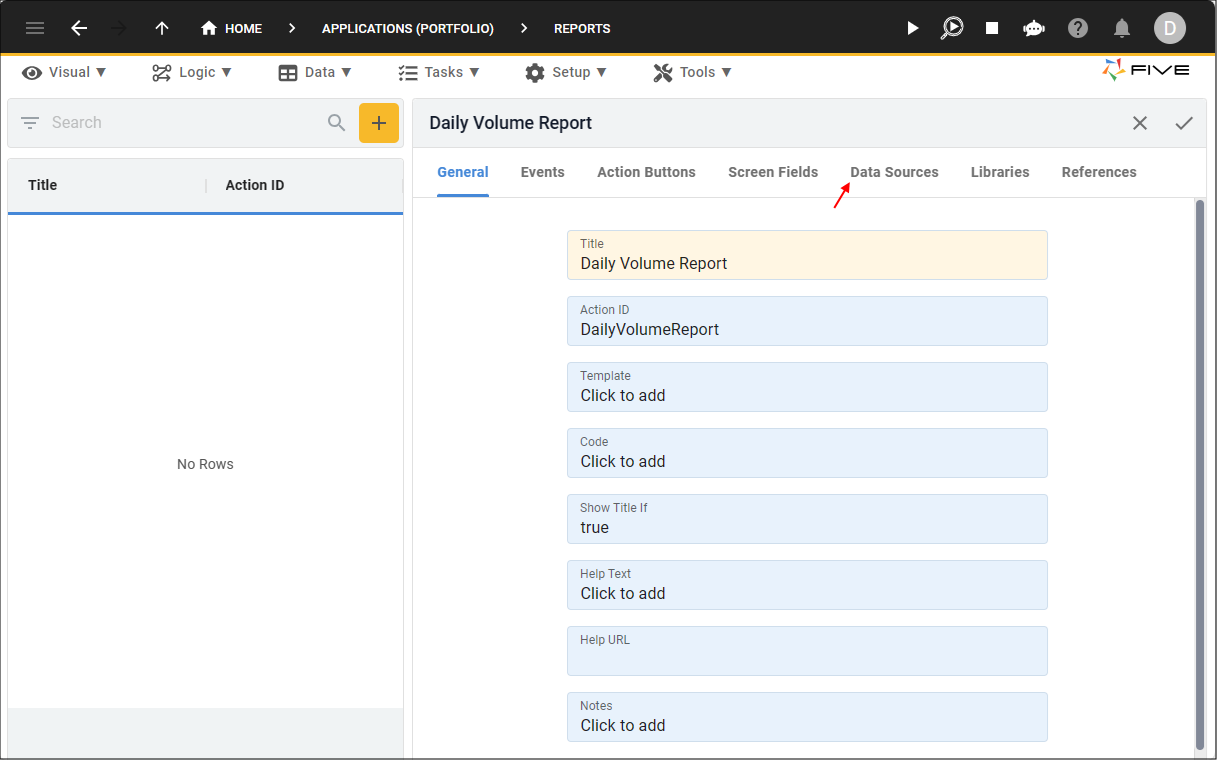
Figure 3 - Data Sources tab
4. Click the Add Data Sources button.
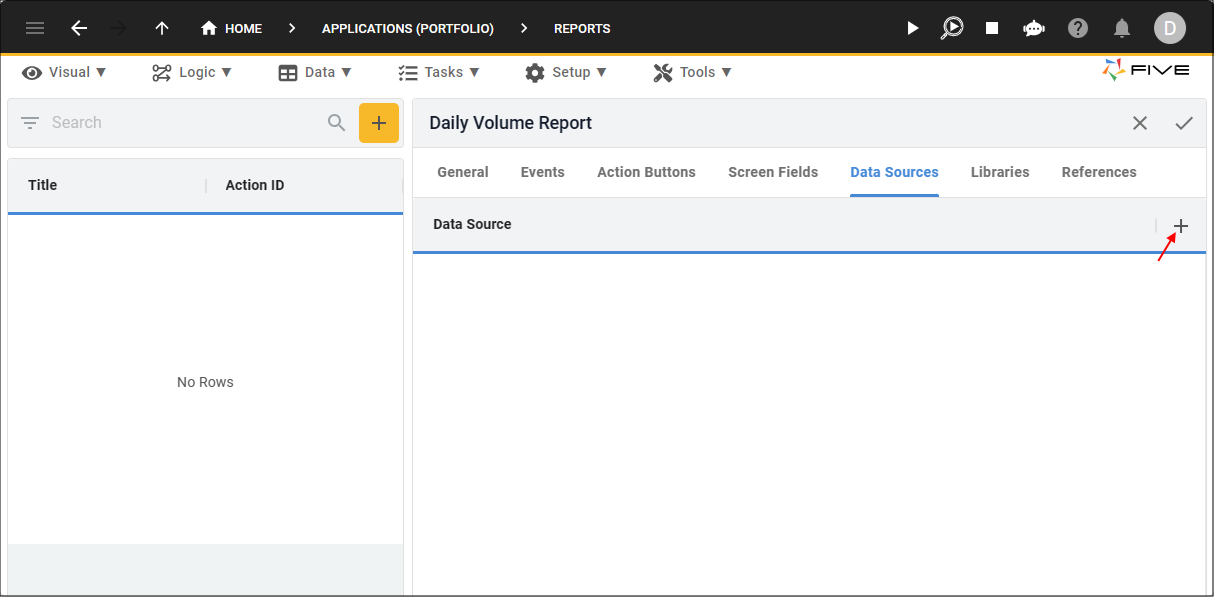
Figure 4 - Add Data Sources button
5. Click the lookup icon in the Data Source field and select DailyVolumeQuery (Query).
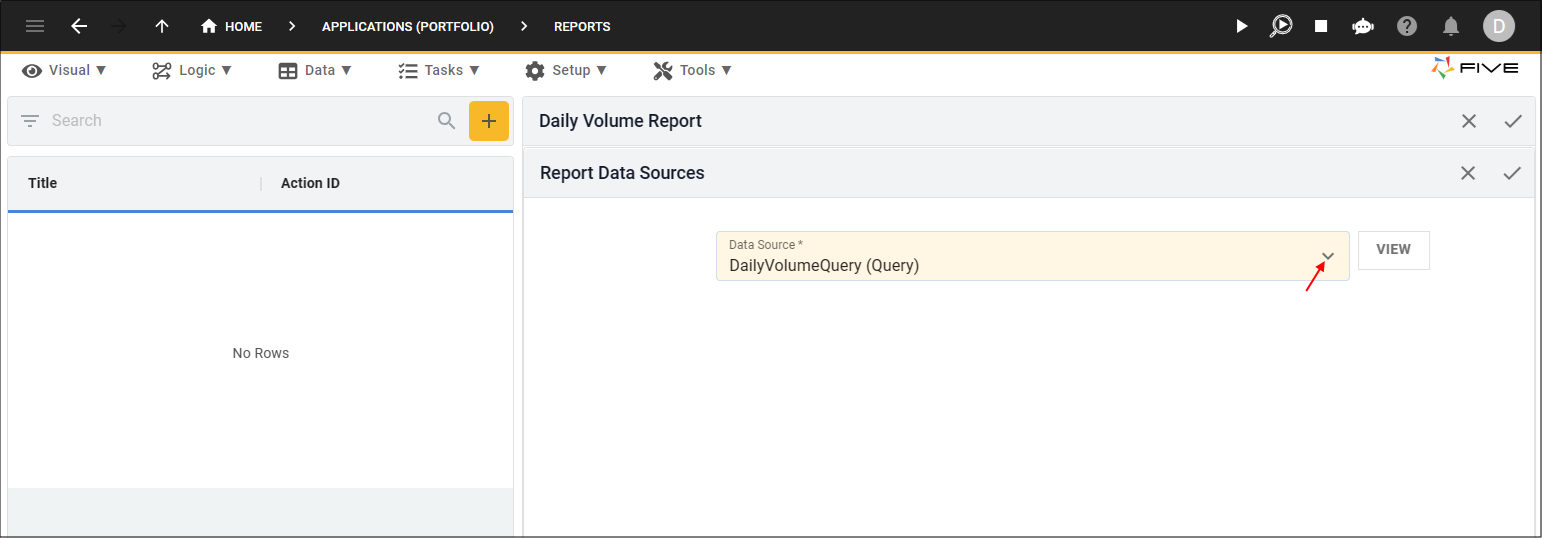
Figure 5 - Data Source field
6. Click the Save button in the form app bar.
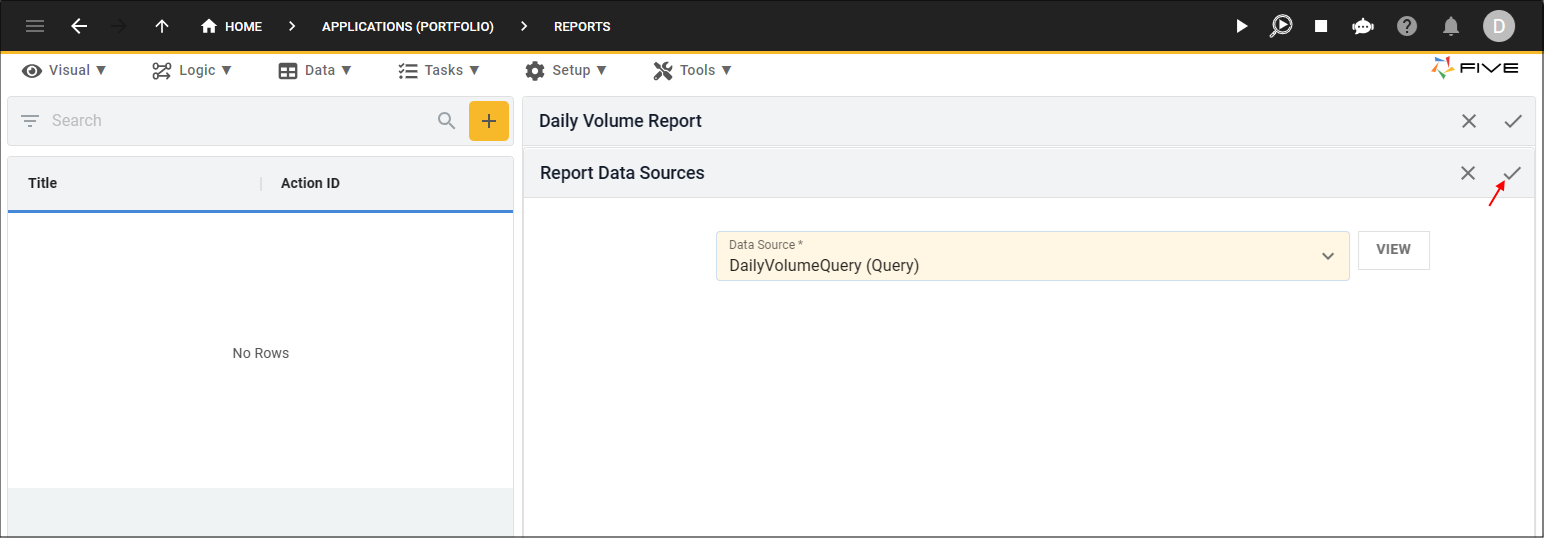
Figure 6 - Save button
7. Click the General tab.
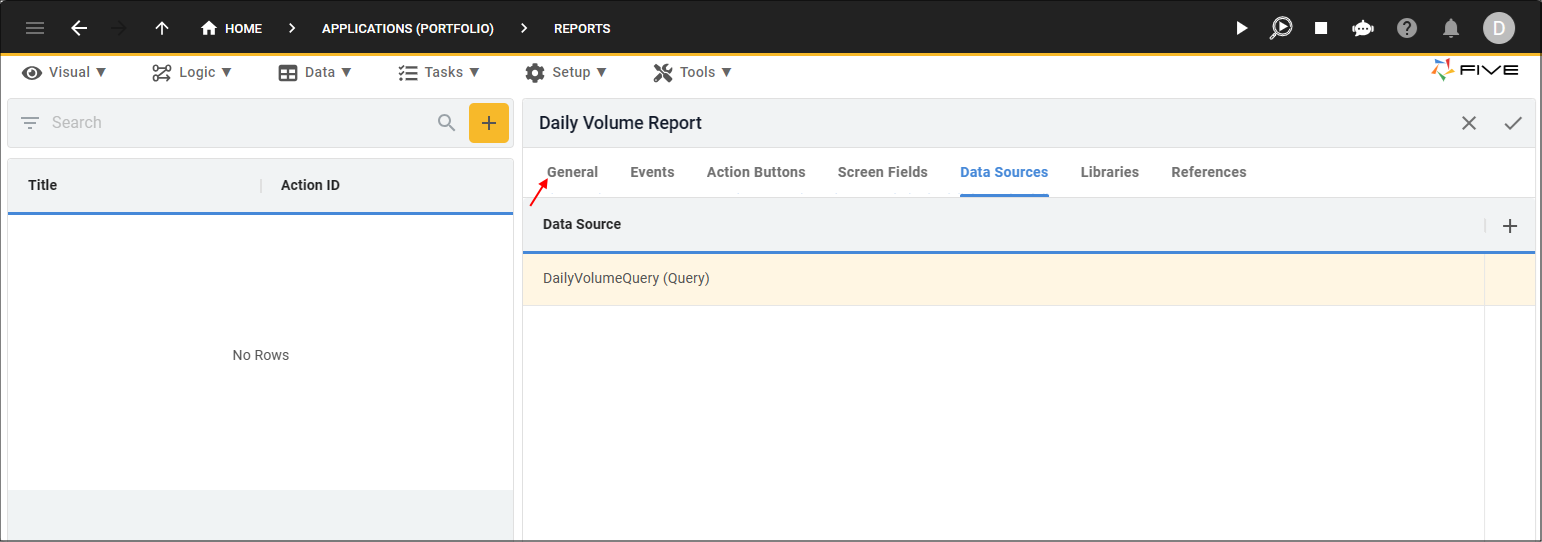
Figure 7 - General tab
8. Click in the Template field.
info
When you click in the Template field it will open Five's Rich Editor, this editor is used in various places in Five.
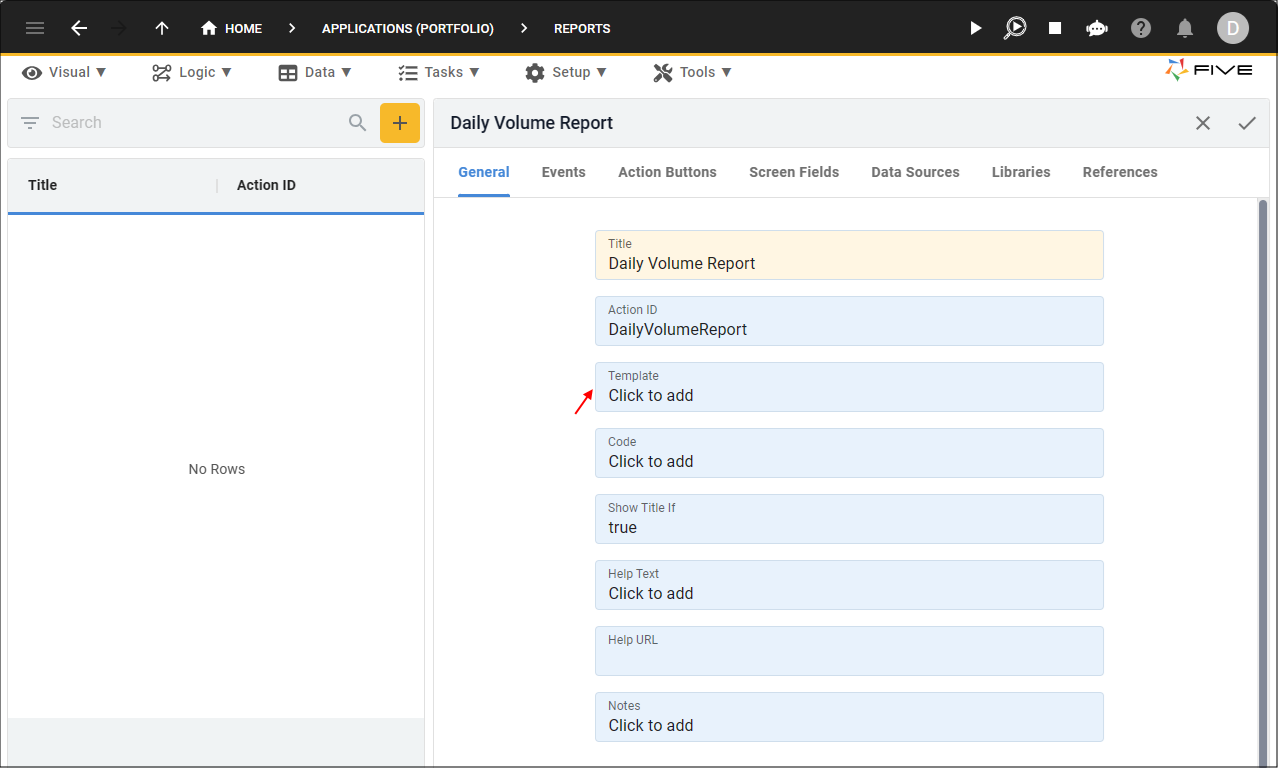
Figure 8 - Template field
info
The ribbon across the top of the editor is used to design your report template.
9. Click the Insert Format Block icon and select Heading 1.
Figure 9 - Insert Format Block icon
10. Type Daily Volume January 2020 in the template and press Enter/Return.
11. Click the Insert Table icon.
info
You will need to add a table and use Five's _Each built in function to separate the rows in your data source.
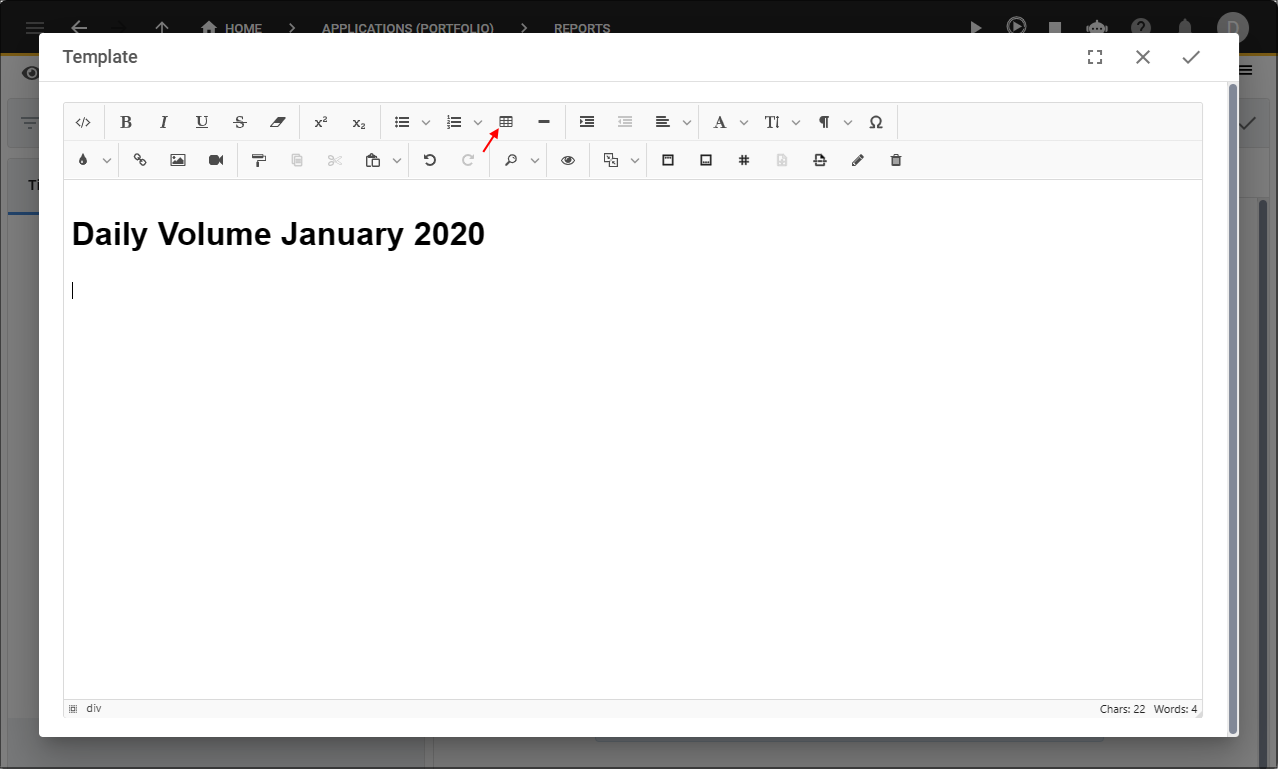
Figure 10 - Insert Table icon
12. Highlight two cells vertically and four cells horizontally.
tip
It is not important if you do not select the correct amount of cells required as Five will dynamically add the necessary cells to your table!
Figure 11 - Highlight table cells
13. Click the Insert Fields icon.
info
You add the fields into the template from your data source/s by clicking the Insert Fields icon.
Figure 12 - Insert Fields icon
14. Click the lookup icon in the Data Source field and select DailyVolumeQuery.
15. Click the lookup icon in the Reserved Field field and select Captions.
info
The captions are the column headers.
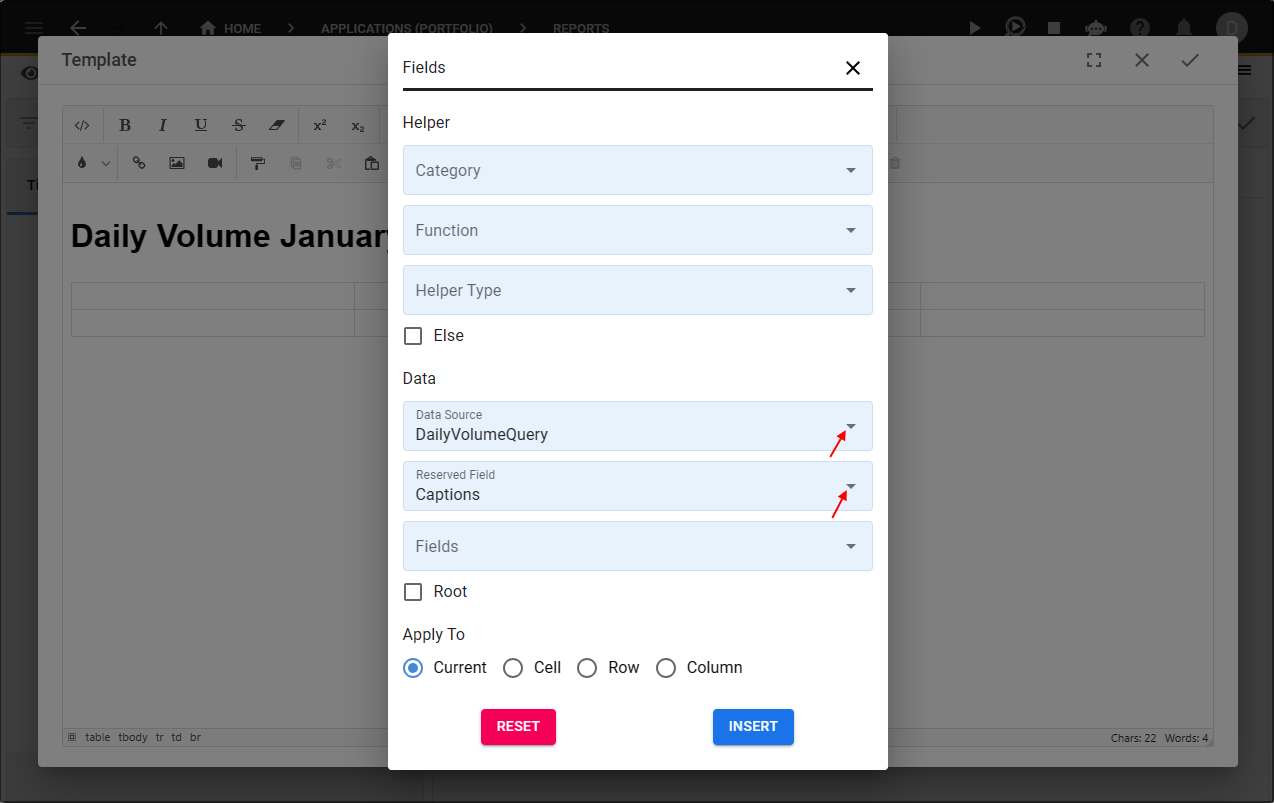
Figure 13 - Add captions
16. Click the lookup icon in the Fields field and click the checkboxes for the Price Date, Stock Code, Name, and Volume fields.
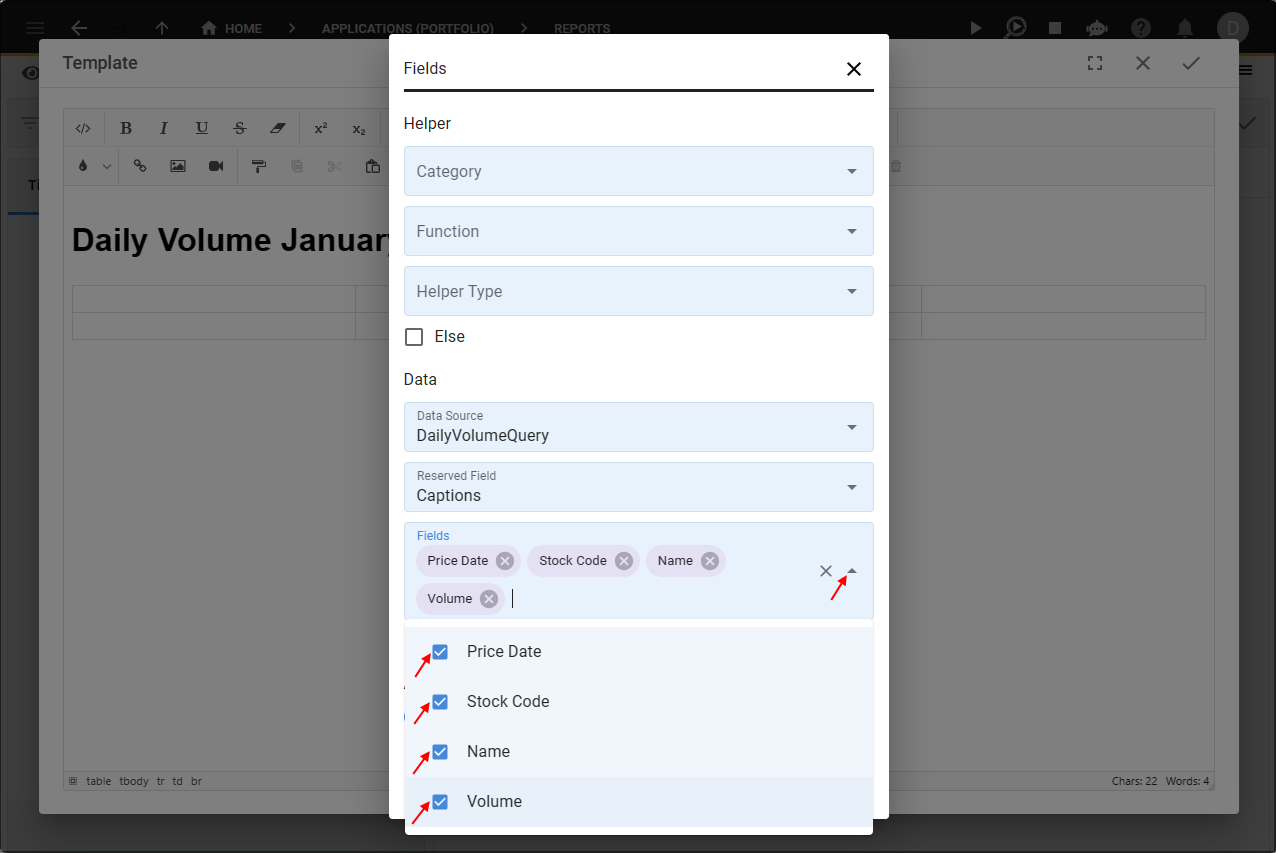
Figure 14 - Select captions
17. Click the Row checkbox.
info
By applying the Row option, Five will separate the captions into indivdual cells across the row.
18. Click the Insert button.
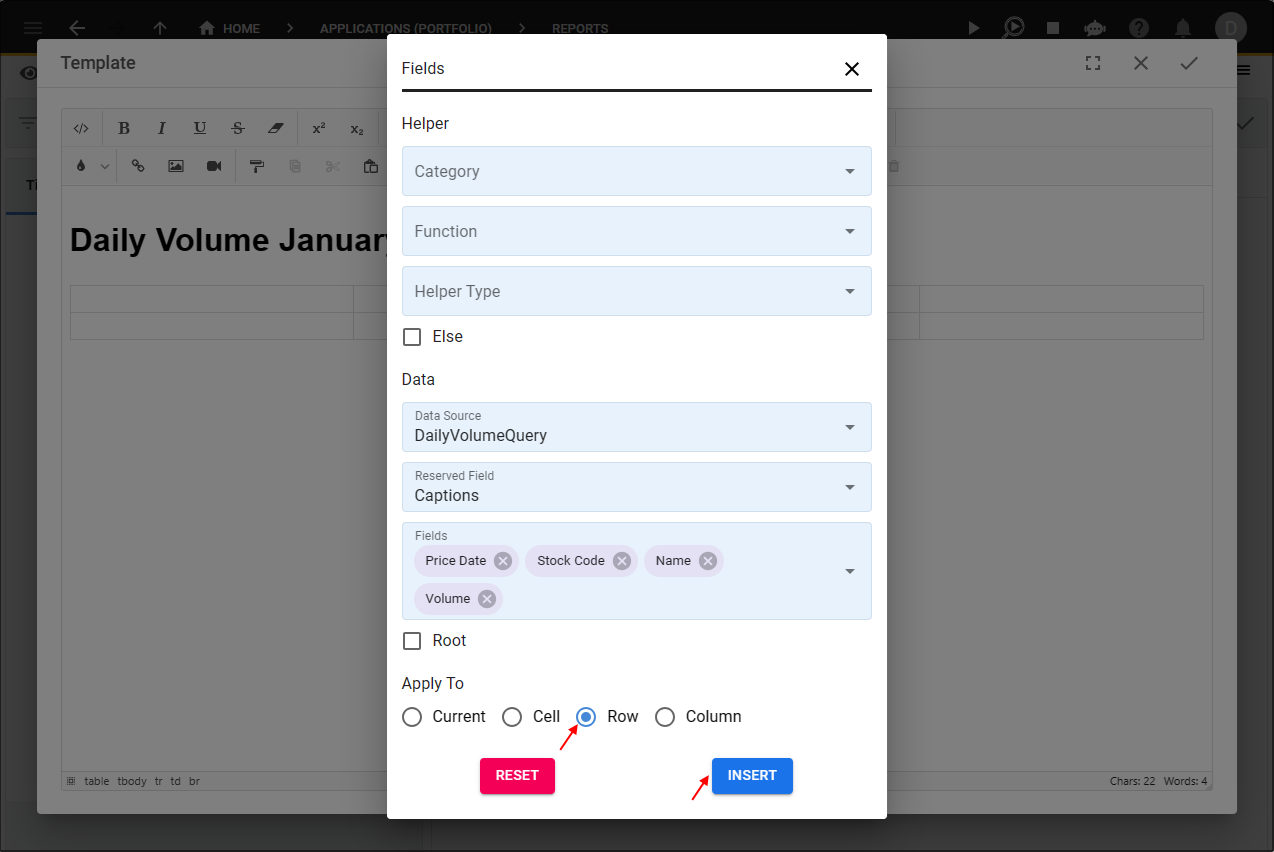
Figure 15 - Insert button
19. Highlight each caption and click the Bold icon.
20. Click in the next available cell after the Volume caption.
Figure 16 - Bold icon
21. Click the Insert Fields icon.
Figure 17 - Insert Fields icon
22. Click the lookup icon in the Category field and select Built In.
info
There are two categories, the Built In category enables you to use Five's built in functions. The Custom Made category enables you to write your
own custom code to add extra functionality you may need for your report. To do this, you need to add your functions into Five's Code Editor on the General page and then they will
be available in the Function lookup after you have selected the category Custom Made.
23. Click the lookup icon in the Function field and select _Each.
info
The _Each function will separate all the records in the returned result.
24. Click the lookup icon in the Data Source field and select DailyVolumeQuery.
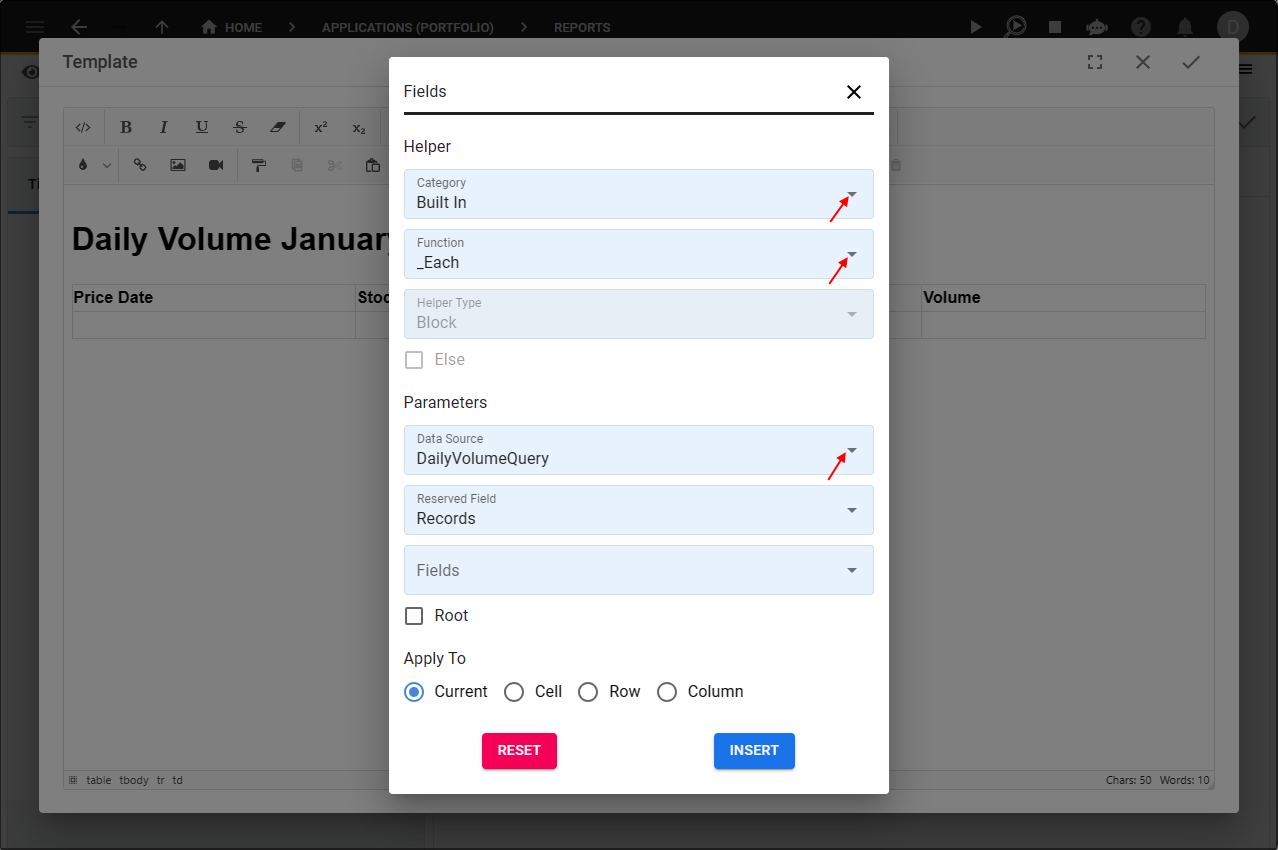
Figure 18 - Add records
25. Click the lookup icon in the Fields field and click the checkboxes for the StockPrice.PriceDate, Stock.StockCode, Stock.Name, StockPrice.Volume fields.
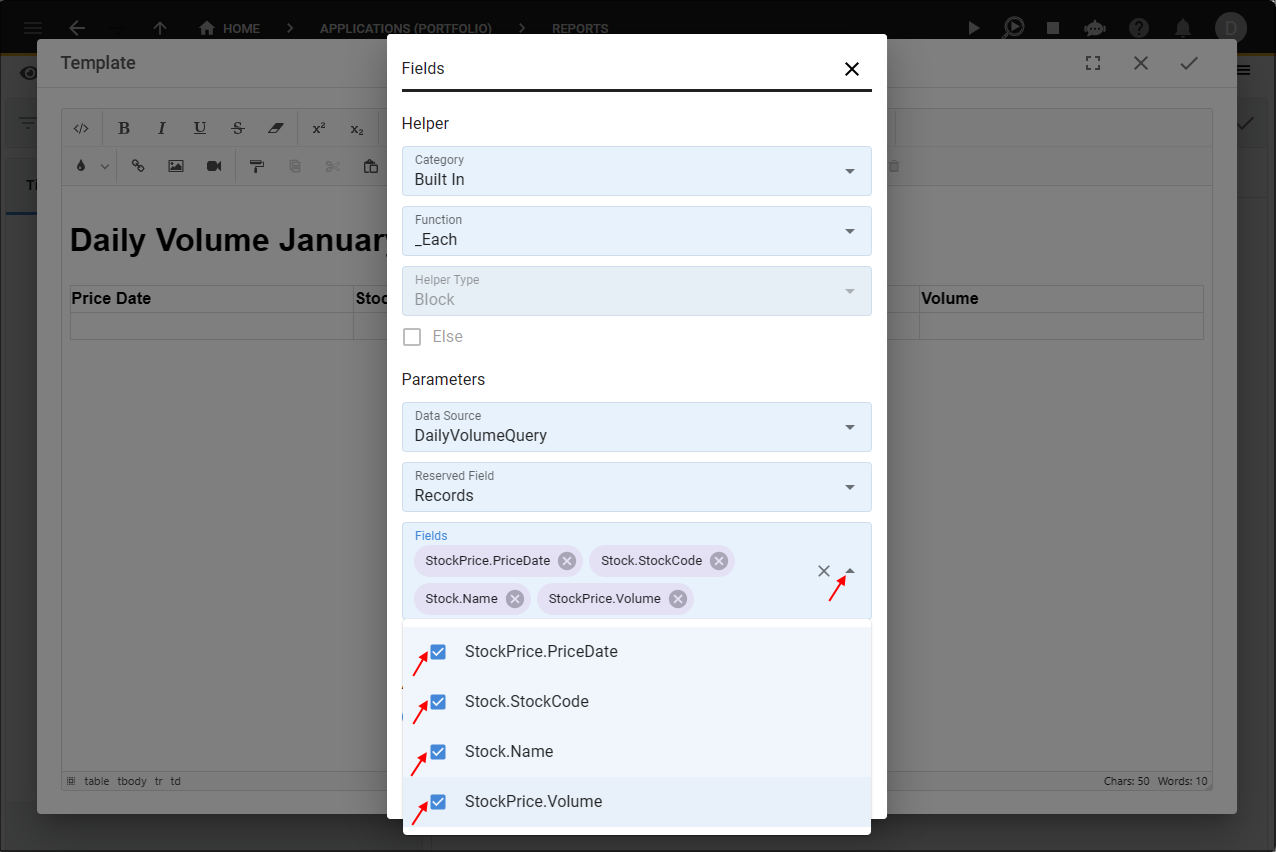
Figure 19 - Select fields
26. Click the Row checkbox.
27. Click the Insert button.
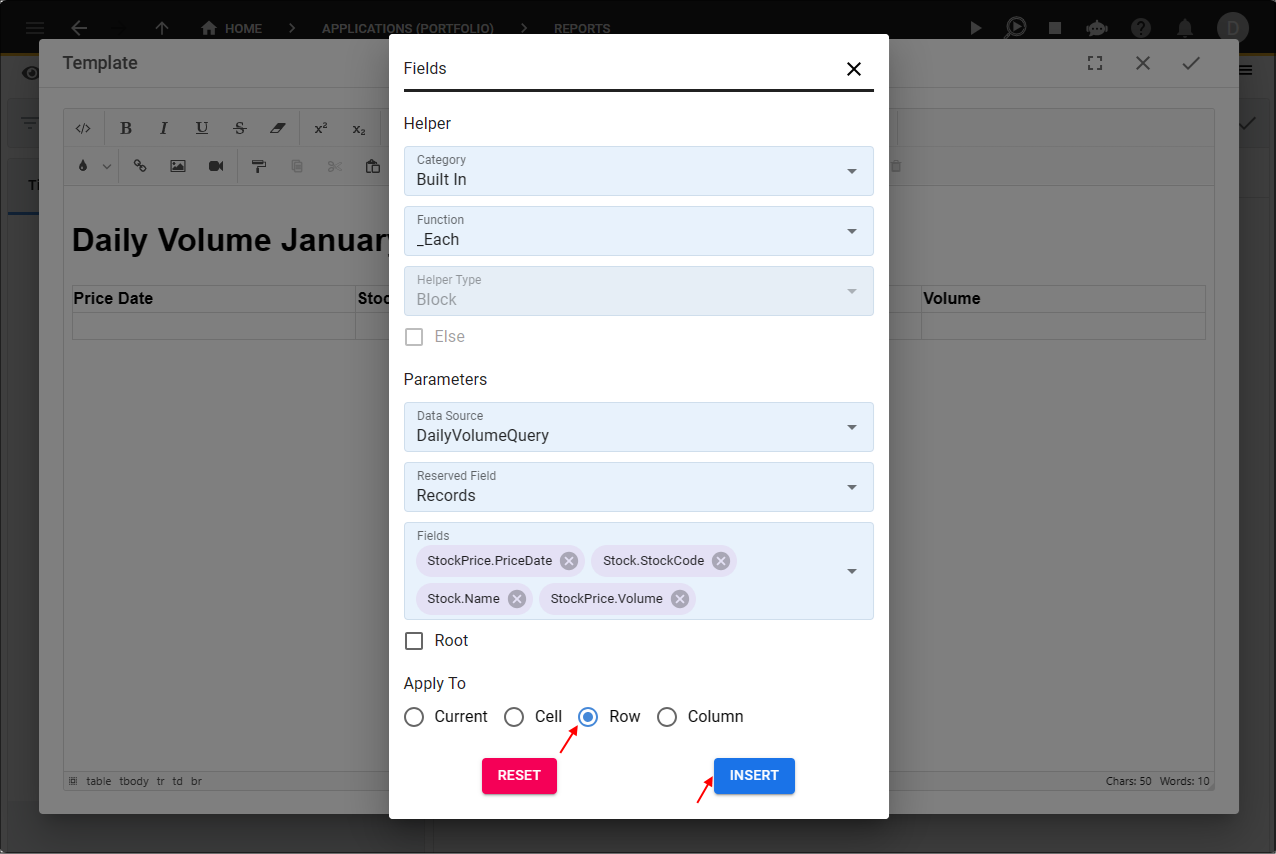
Figure 20 - Insert button
28. Click the Save button in the editor app bar.
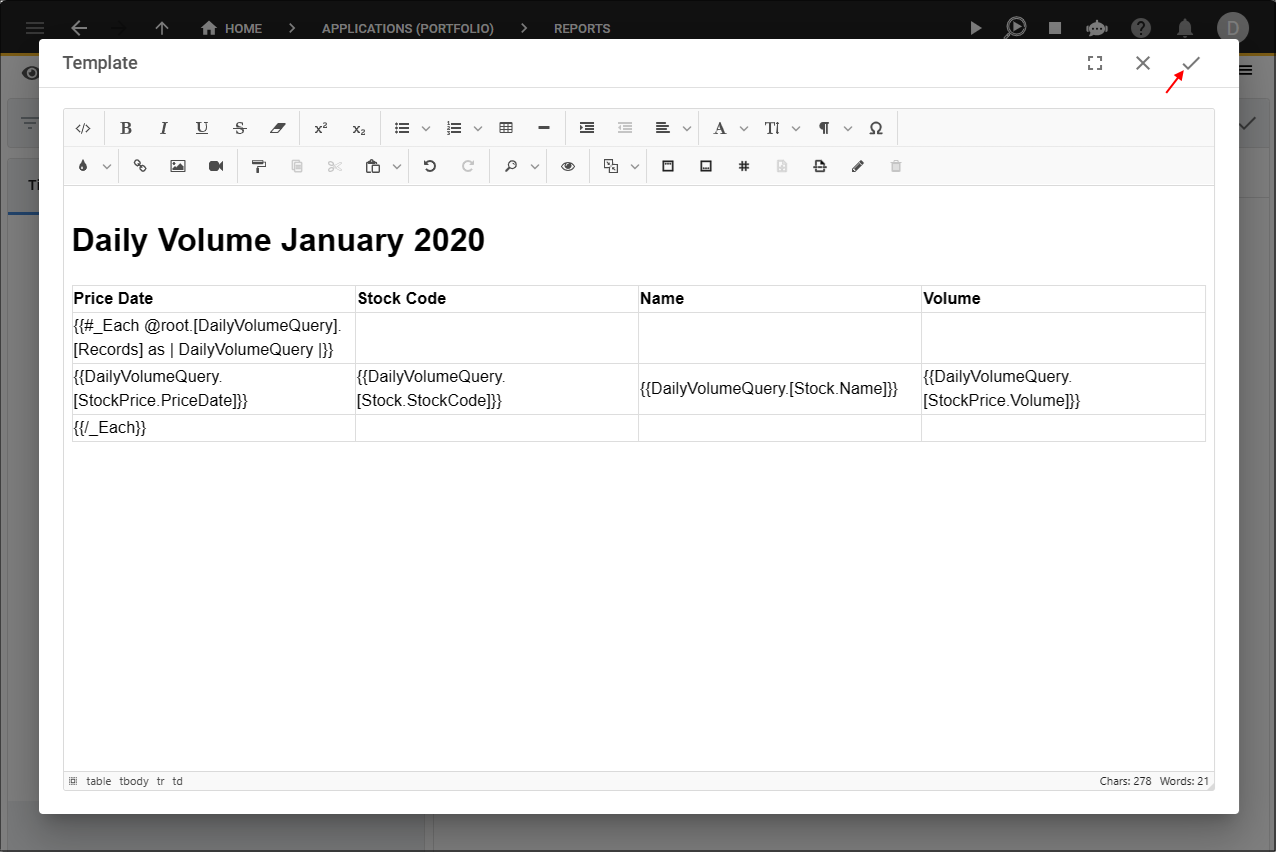
Figure 21 - Save button
29. Click the Save button in the form app bar.
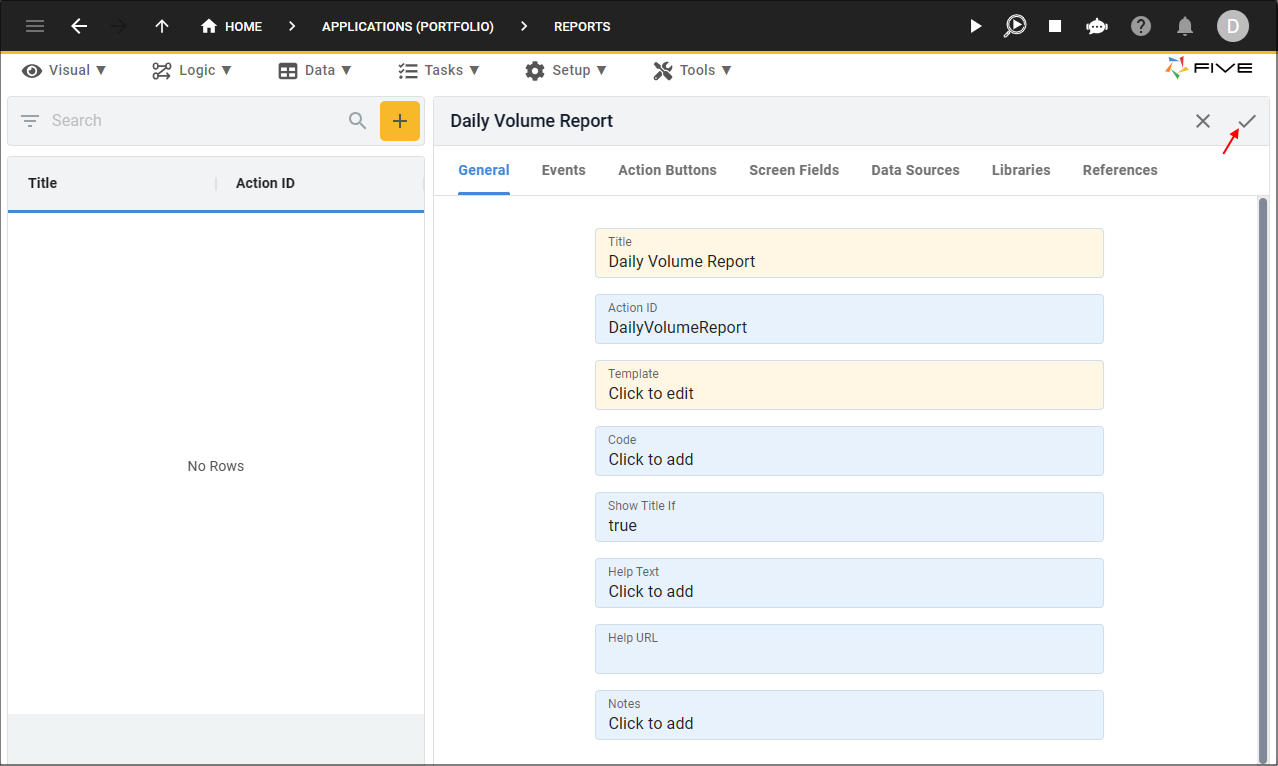
Figure 22 - Save button
info
There are two ways to make your report available in your application. You can either create a menu item for it, or create an action button which
will make the report available when the button is clicked. For this documentation, a menu item will be created for the Daily Volume Report.
Navigate to Menus
1. Click Visual in the Menu.2. Click Menus in the sub-menu.
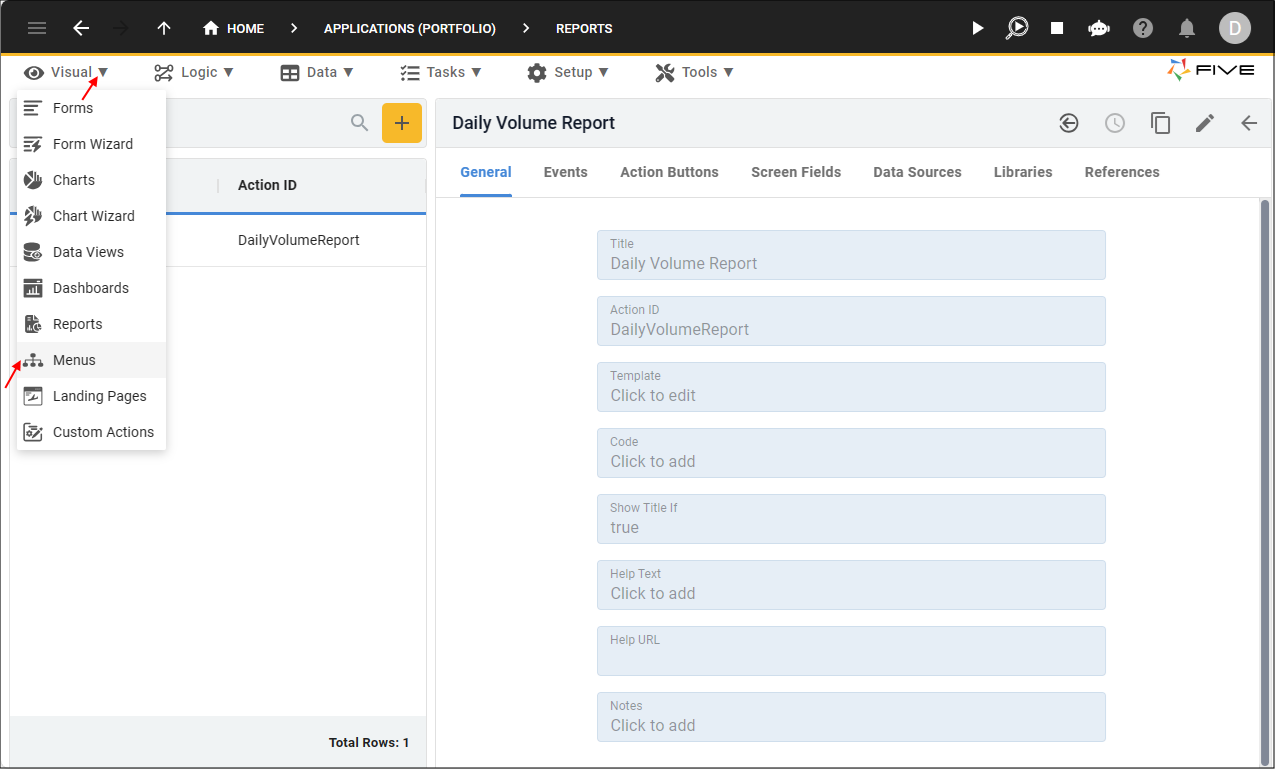
Figure 23 - Menus menu item
Add the Daily Volume Report Menu
1. Click the Add Item button.2. Type Daily Volume Report in the Caption field.
3. Type 5 in the Menu Order field.
4. Click the lookup icon in the Action field and select DailyVolumeReport (Report).
5. Optional: Click the Edit button in the Icon field and open an image file.
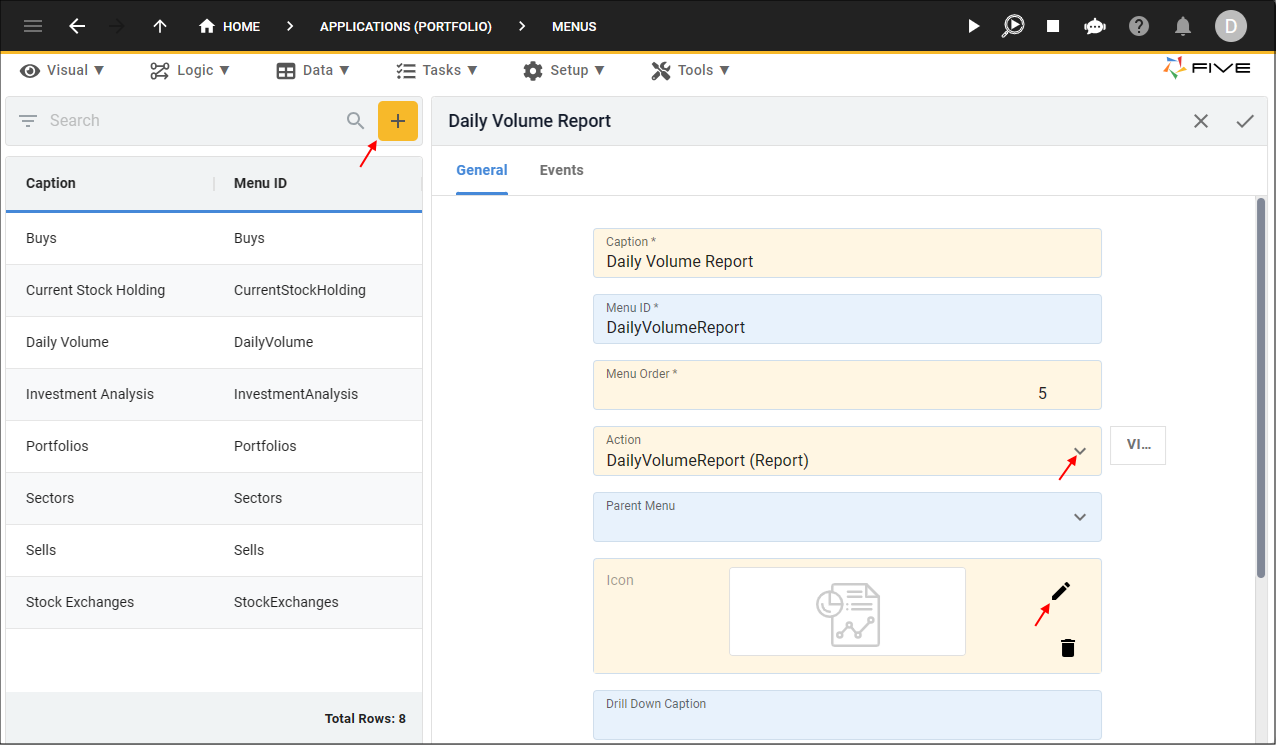
Figure 24 - Add the Daily Volume Report menu item
6. Click the Save button in the form app bar.
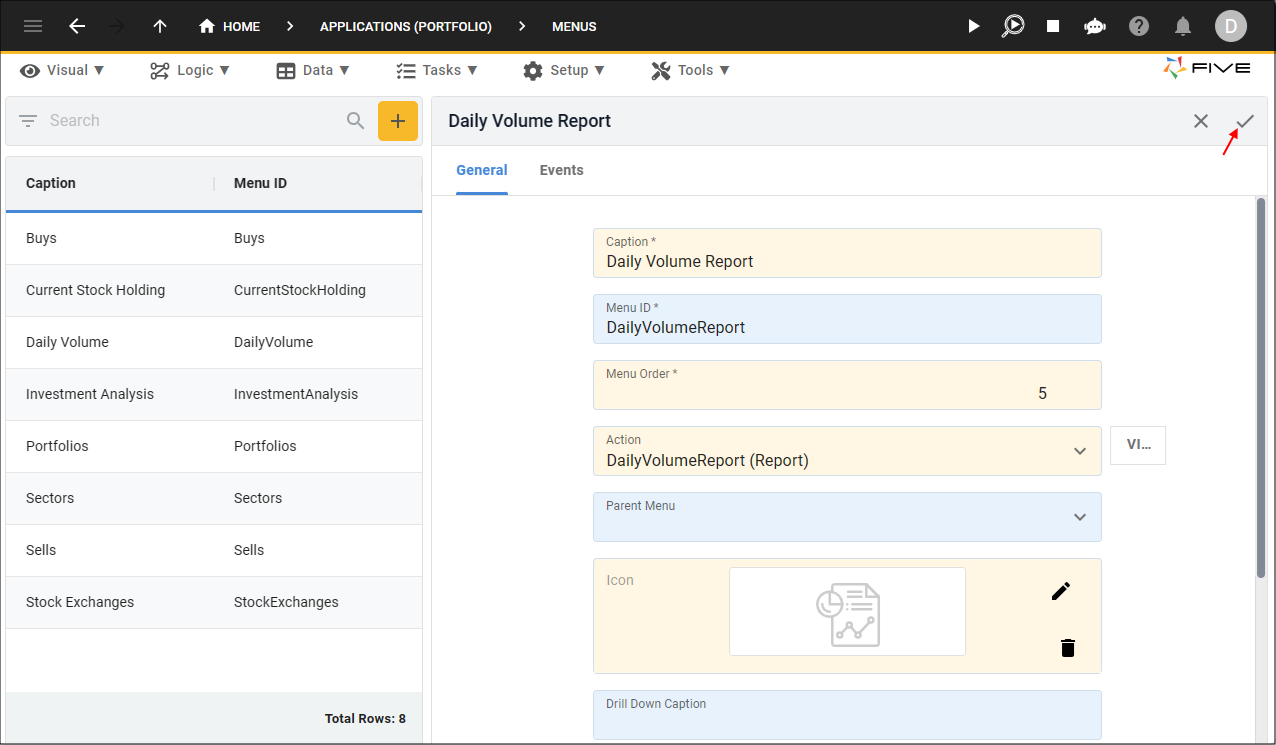
Figure 25 - Save button
tip
This is a good time to run the Portfolio application to check your Daily Volume Report!
info
How long your report takes to generate is dependent on the number of records that are returned.
Figure 26 - Daily Volume Report