8 - Create a Chart
Last updated 12/12/2023
A chart can be built two ways in Five. You can use either:- Five's Chart Wizard; or
- The Chart Form
Five's Data Sources
- Connections
- Queries
- Tables
Navigate to the Chart Wizard
1. Select Visual in the menu.2. Select Chart Wizard in the sub-menu.
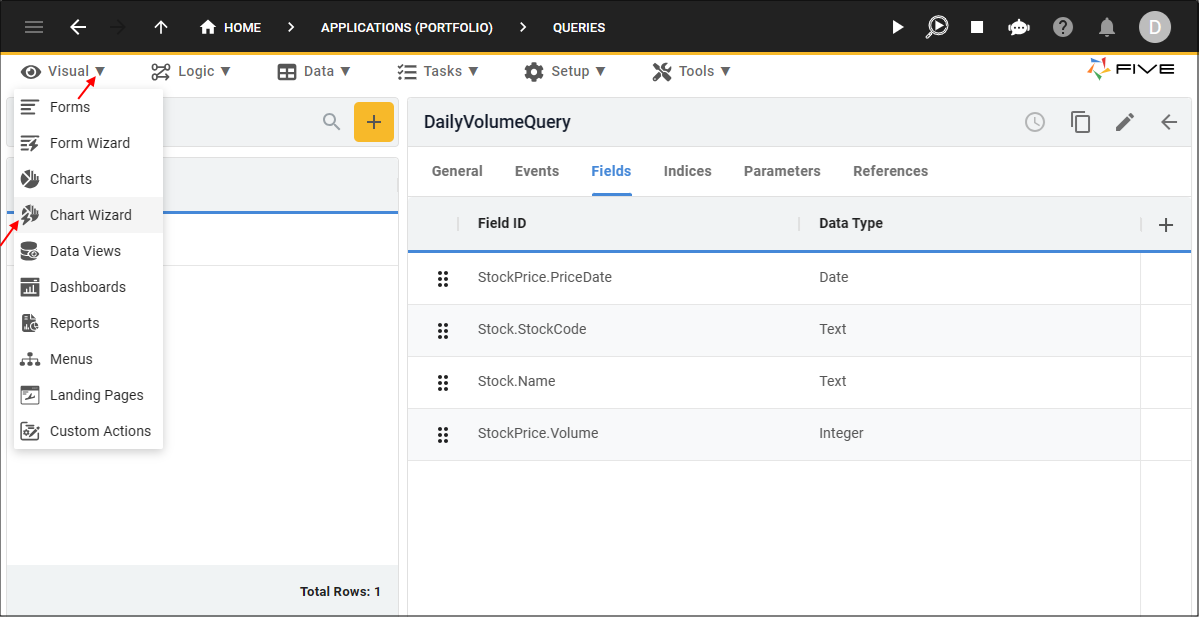
Figure 1 - Chart Wizard menu item
Add the Daily Volume Chart
info
The DailyVolumeQuery that you just added will be used as the data source for the chart result set.
1. Type Daily Volume in the Chart Title field.
2. Click the lookup icon in the Data Source field and select DailyVolumeQuery.
3. Click the lookup icon in the X Value Column field and select StockPrice.PriceDate.
4. Click the lookup icon in the Y Value Column field and select StockPrice.Volume.
info
The wizard will strip your WHERE clauses while in the Chart Wizard, however, the correct data will be displayed in the Portfolio application. The WHERE clause is stripped
and limited to 1000 records so we can have some sample data to view in the wizard.
6. Type January 2020 in the Chart Area Title field.
7. Click the Show Chart Area Title switch.
8. Click the lookup icon in the Chart Type field and select Line.
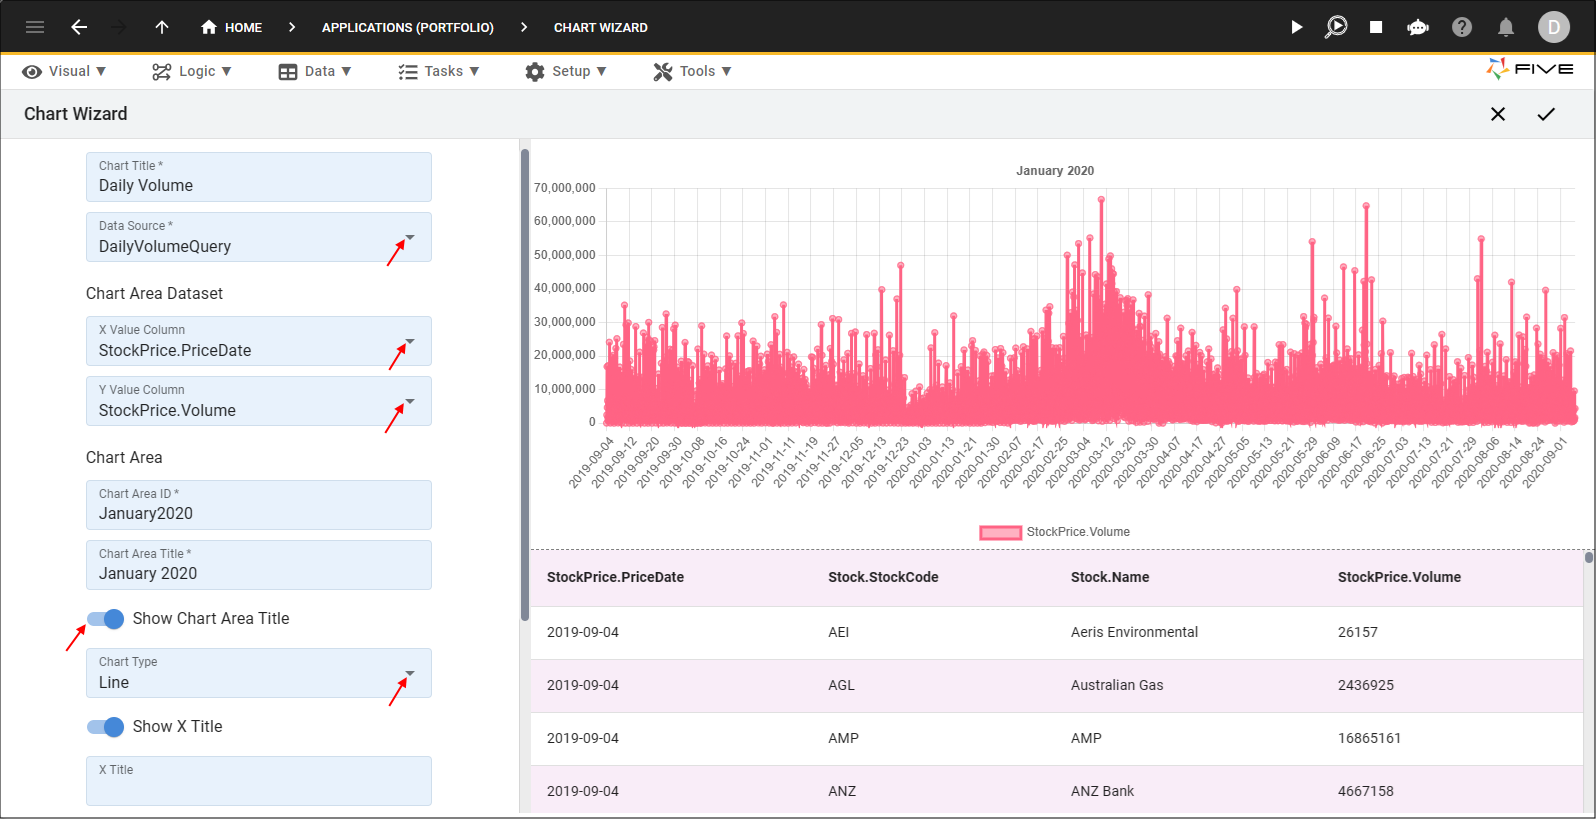
Figure 2 - Add the Daily Volume chart
9. Click in the Color Picker field.
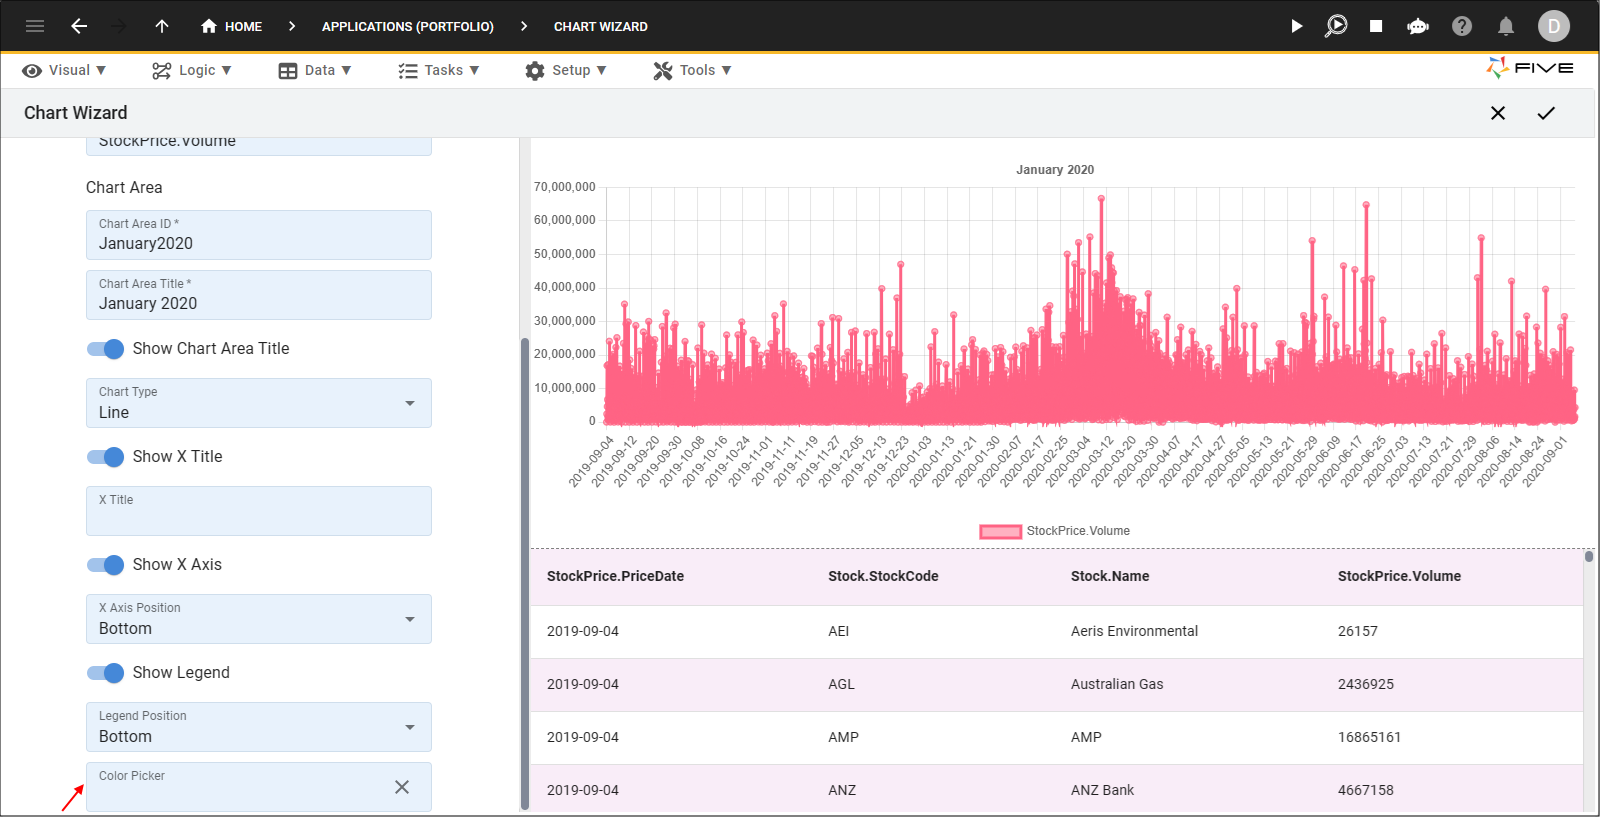
Figure 3 - Color Picker field
10. Click on a color block.
11. Click the Save button in the Color Picker app bar.
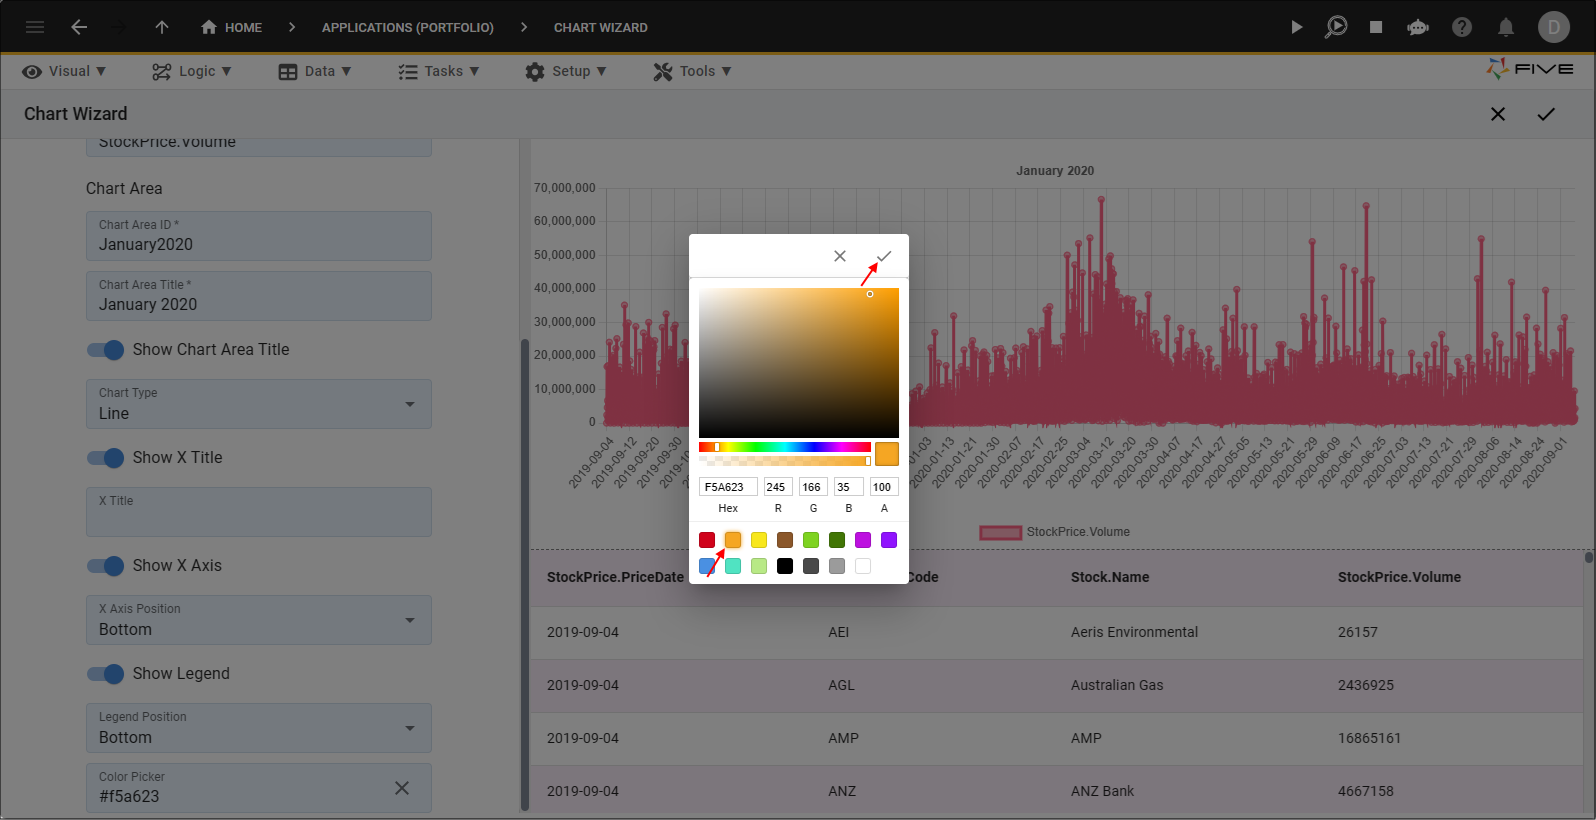
Figure 4 - Select and save a color
12. Click the Save button in the Chart Wizard app bar.
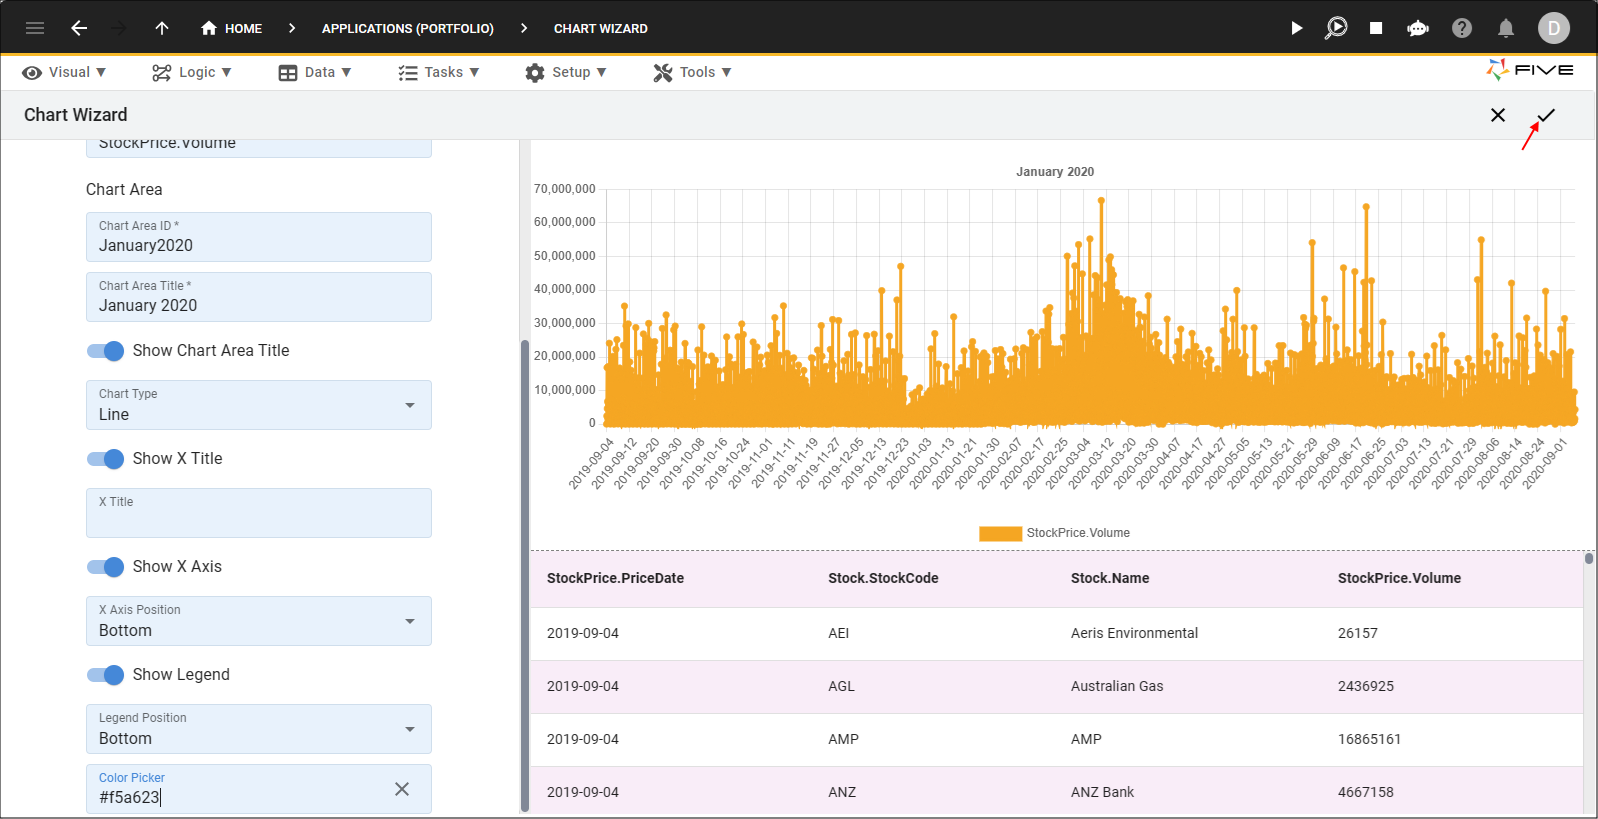
Figure 5 - Save button
tip
Once you have saved a chart via our Chart Wizard, you will find the chart record in the Charts view! To navigate to the Charts view, click
Visual in the menu followed by clicking Charts in the sub-menu.
Figure 6 - Navigate to the Daily Volume chart record