10 - Create Charts with Multiple Datasets
Last updated 5/04/2023
This documentation is to demonstrate how to create charts with multiple datasets. These datasets can be plotted on the same chart or used in different charts that are displayed on the one page. As you would remember from the Quick Start Guide you need a query to return the result set for the chart.We are going to add two charts, one will display our investment by sector and the other our investment by stock.
Navigate to Queries
1. Select Visual in the menu.2. Select Queries in the sub-menu.
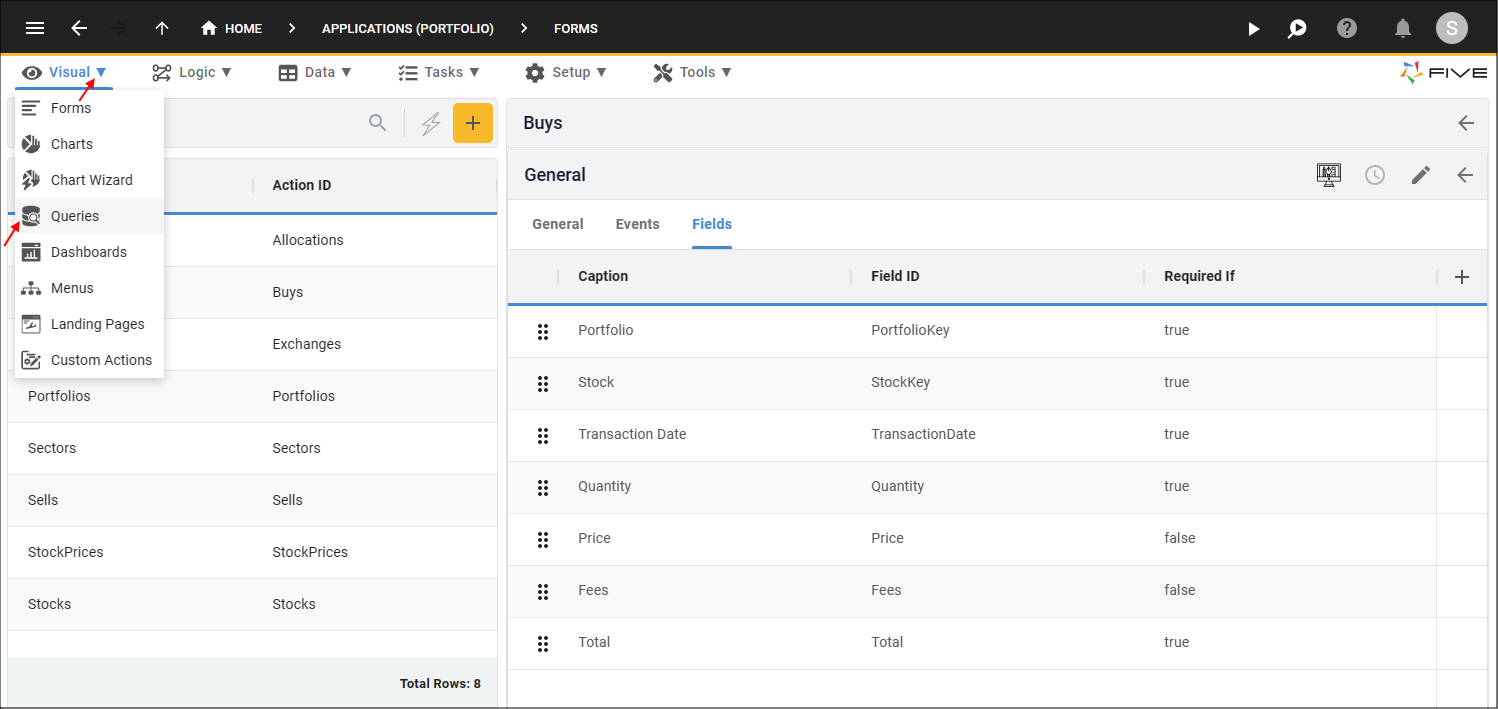
Figure 1 - Queries menu item
Add the Investment by Sector Query
1. Click the Add Item button.2. Type Investment by Sector in the Title field.
3. Click in the Query field to open Five's Query Builder.
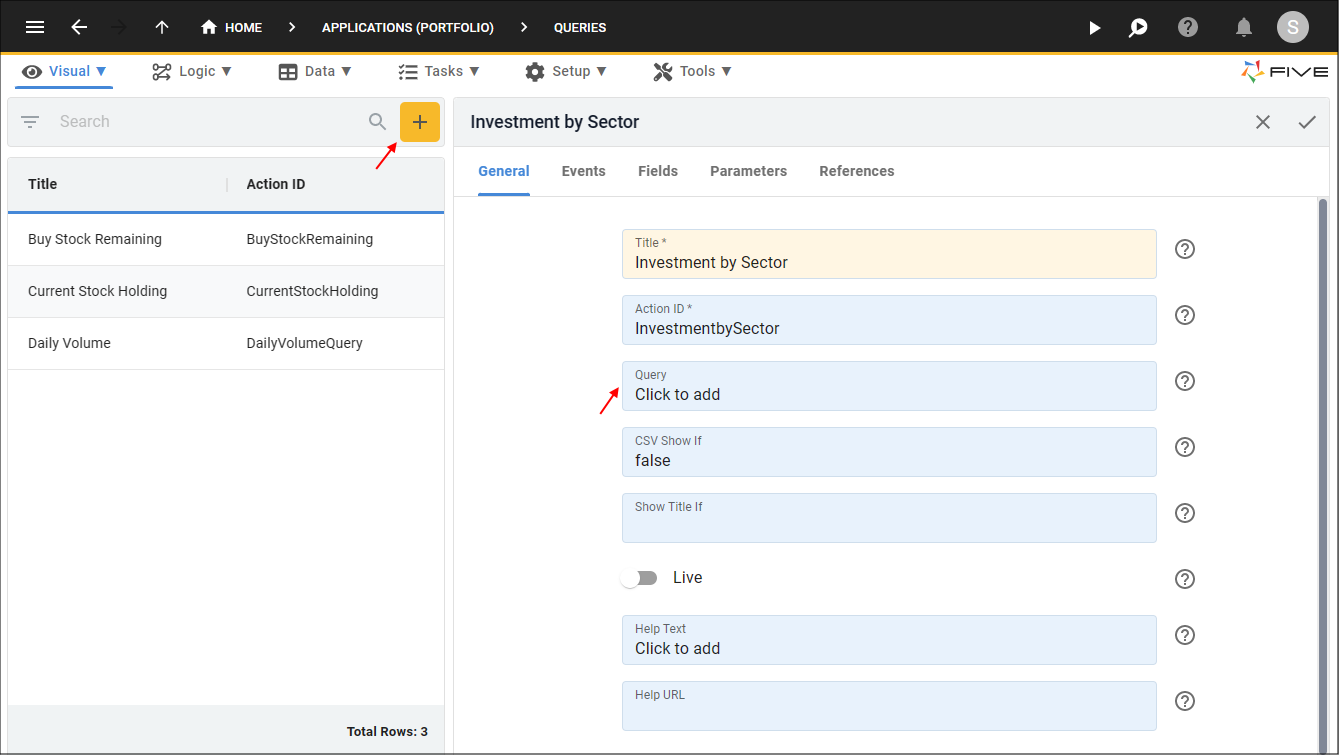
Figure 2 - Add the Investment by Sector query
4. Click the SQL tab.
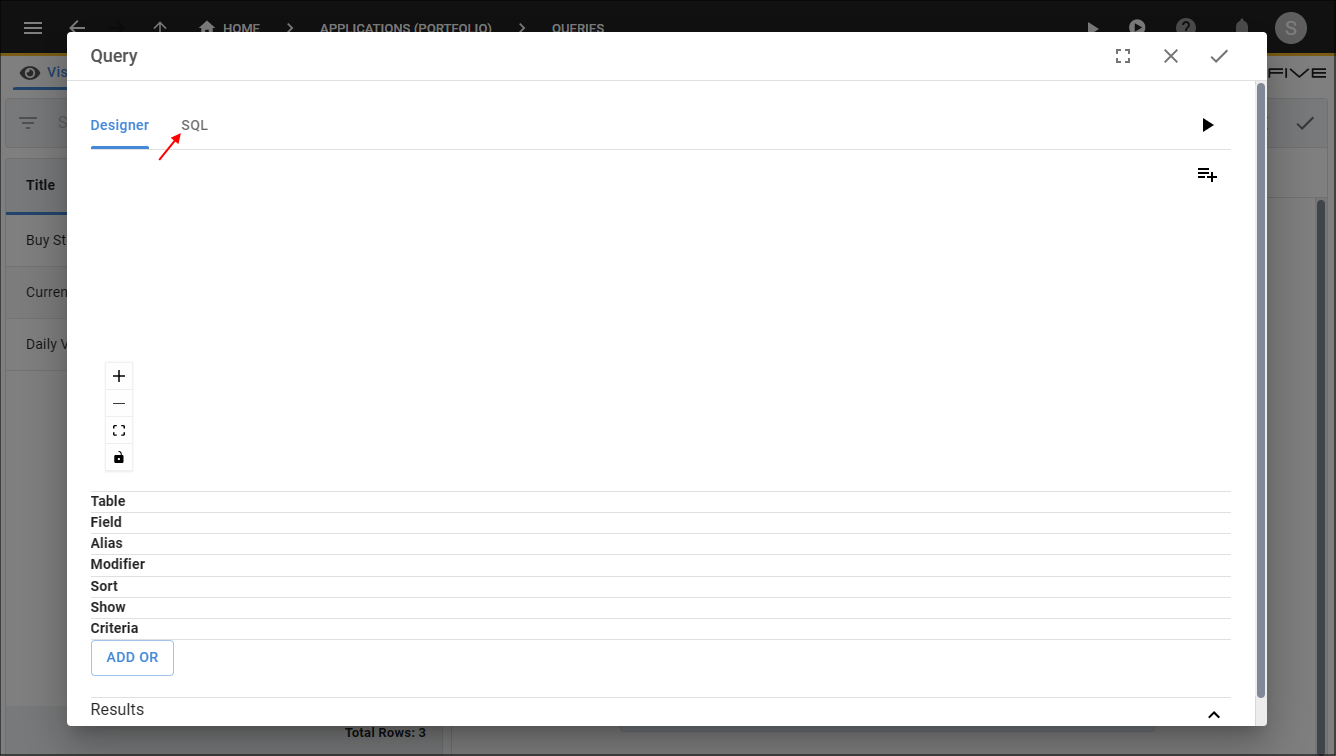
Figure 3 - SQL tab
5. Click the Copy button for the below syntax.
Investment by Sector
SELECT
    Sector,
    StockCode,
    SUM(Bought - Sold) AS Holding,
    SUM(OriginalCost * (Bought - Sold) / Bought) AS Investment
FROM (
    SELECT
        Sector.Name AS Sector,
        Stock.StockCode AS StockCode,
           Buy.PortfolioKey,
        Buy.Quantity AS Bought,
        IFNULL((SELECT SUM(Allocation.Quantity) FROM ALLOCATION WHERE Allocation.BuyKey = Buy.BuyKey),0) AS Sold,
        Buy.Total AS OriginalCost
    FROM
        Buy
        INNER JOIN Stock ON Buy.StockKey = Stock.StockKey
        INNER JOIN Sector ON Stock.SectorKey = Sector.SectorKey
 HAVING
        (Buy.PortfolioKey = ?) AND
        (Bought > Sold)
    ) AS Summary
GROUP BY
    Sector
6. Paste the syntax in the SQL Editor.
7. Click the Save button in the SQL Editor app bar.
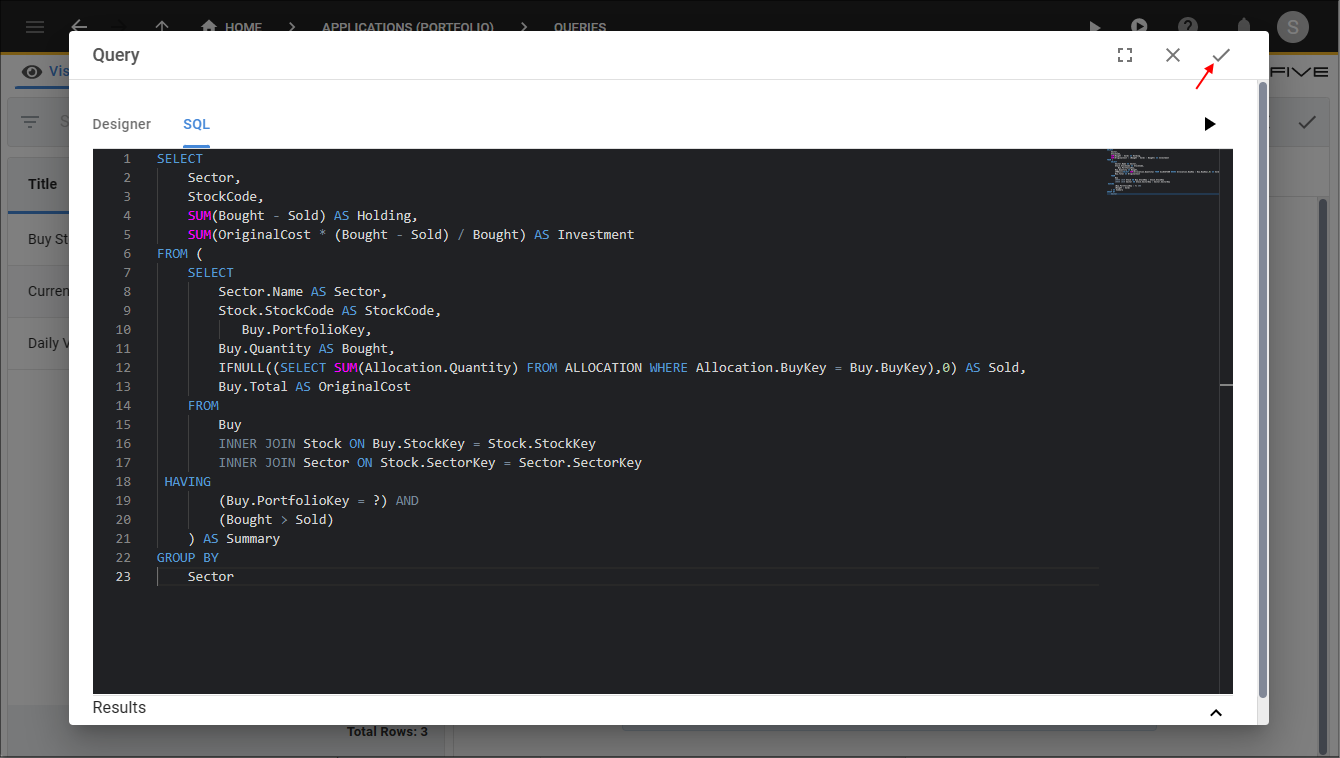
Figure 4 - Save Investment by Sector syntax
8. Click the Fields tab.
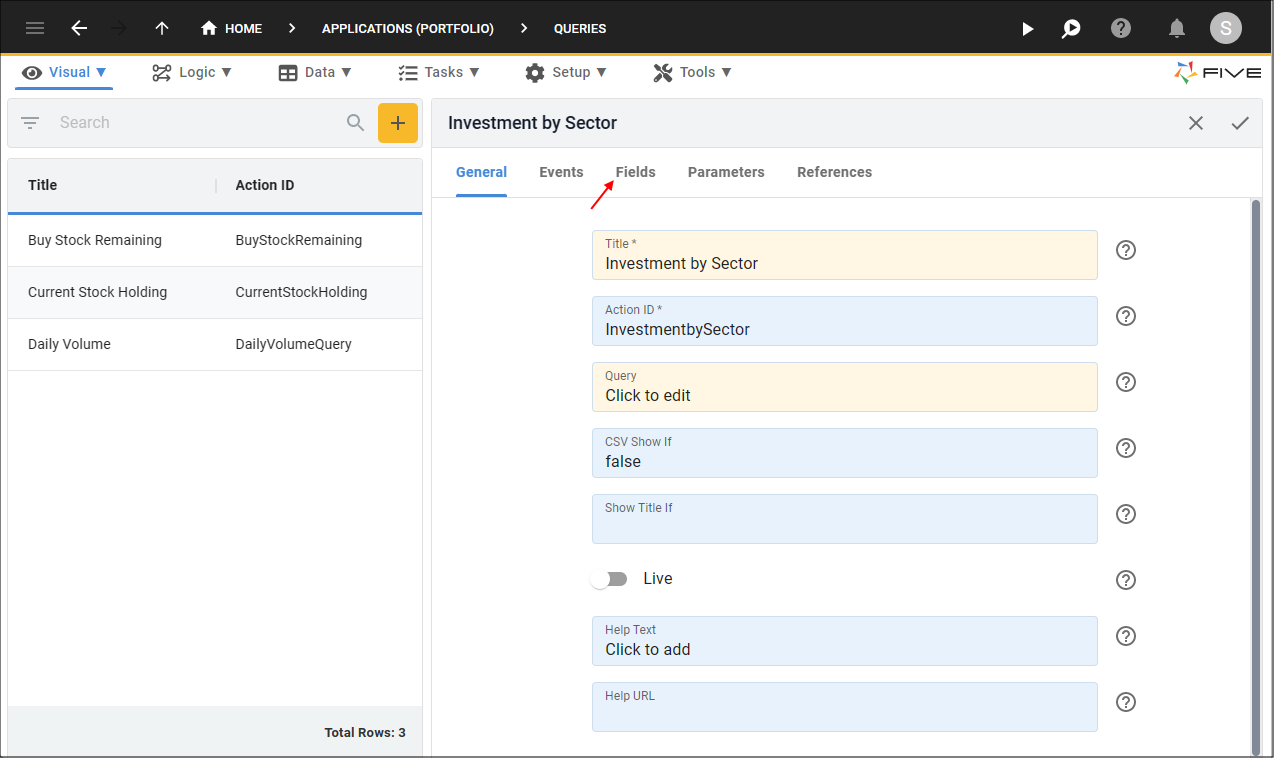
Figure 5 - Fields tab
9. Select the Holding record.
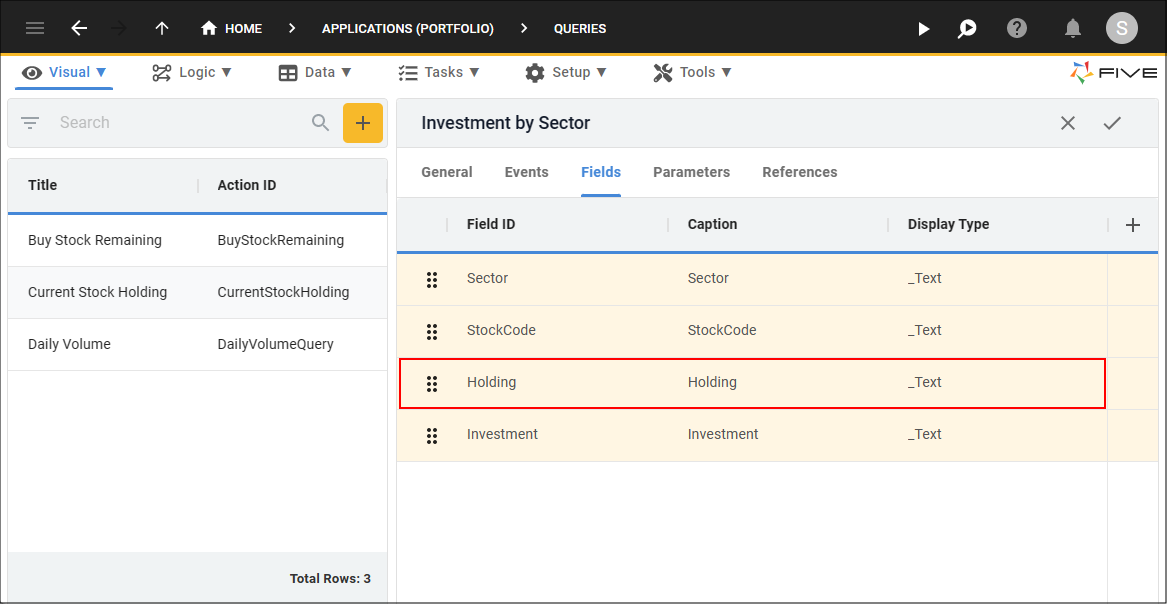
Figure 6 - Holding record
10. Click the lookup icon in the Display Type field and select _Integer.
11. Click the Save button in the form app bar.
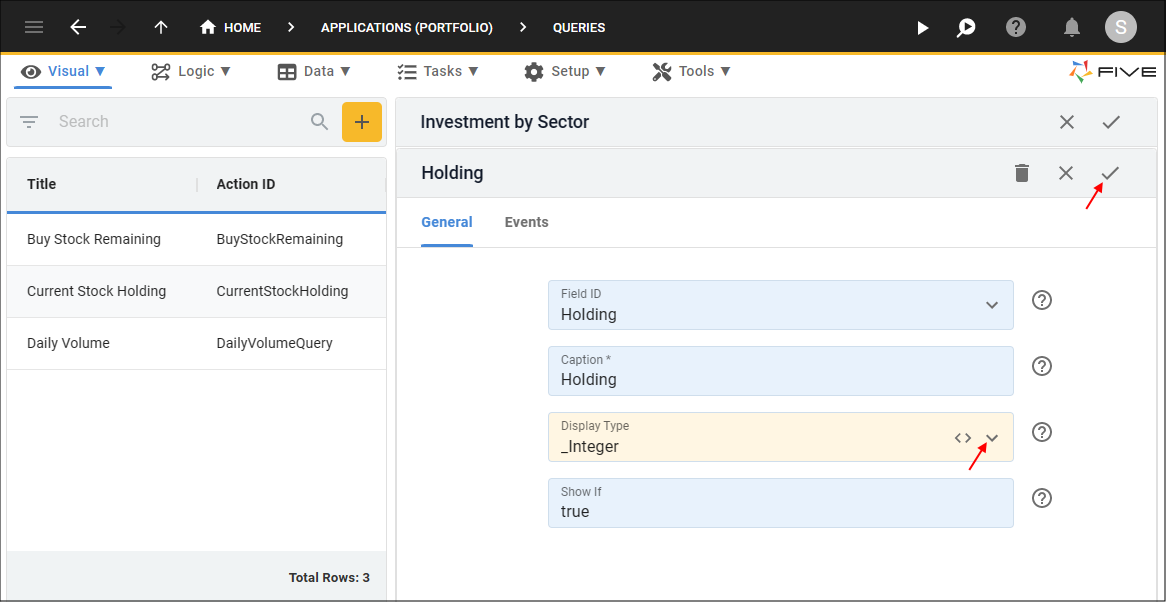
Figure 7 - Edit the Holding record
12. Select the Investment record.
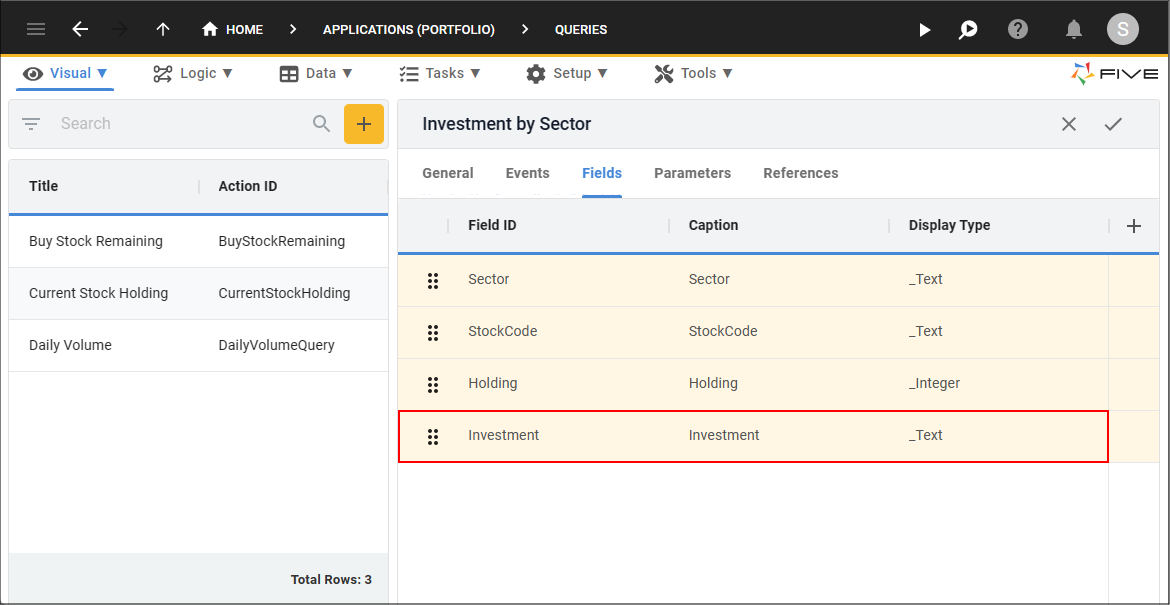
Figure 8 - Investment record
13. Click the lookup icon in the Display Type field and select _Currency.
14. Click the Save button in the form app bar.
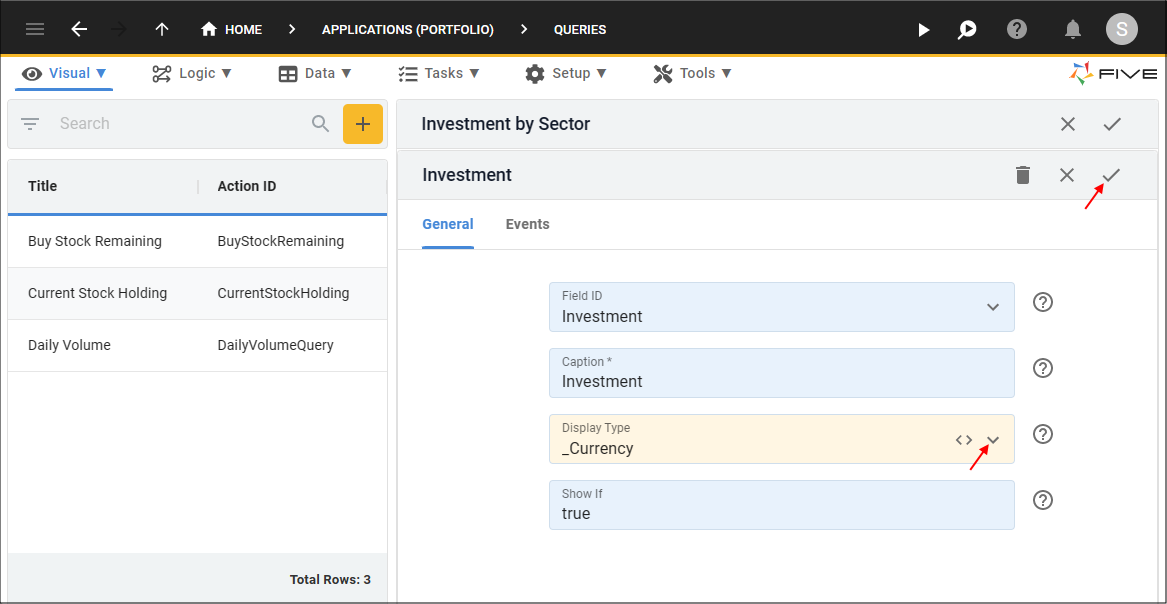
Figure 9 - Edit the Investment record
15. Click the Parameters tab.
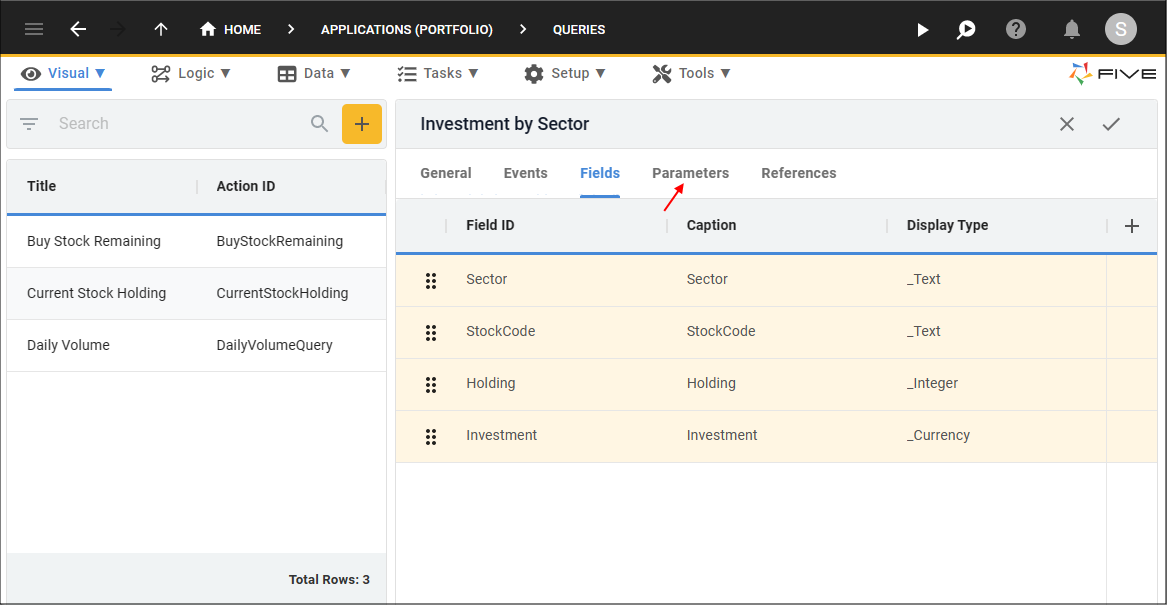
Figure 10 - Parameters tab
16. Click the Add Parameters button.
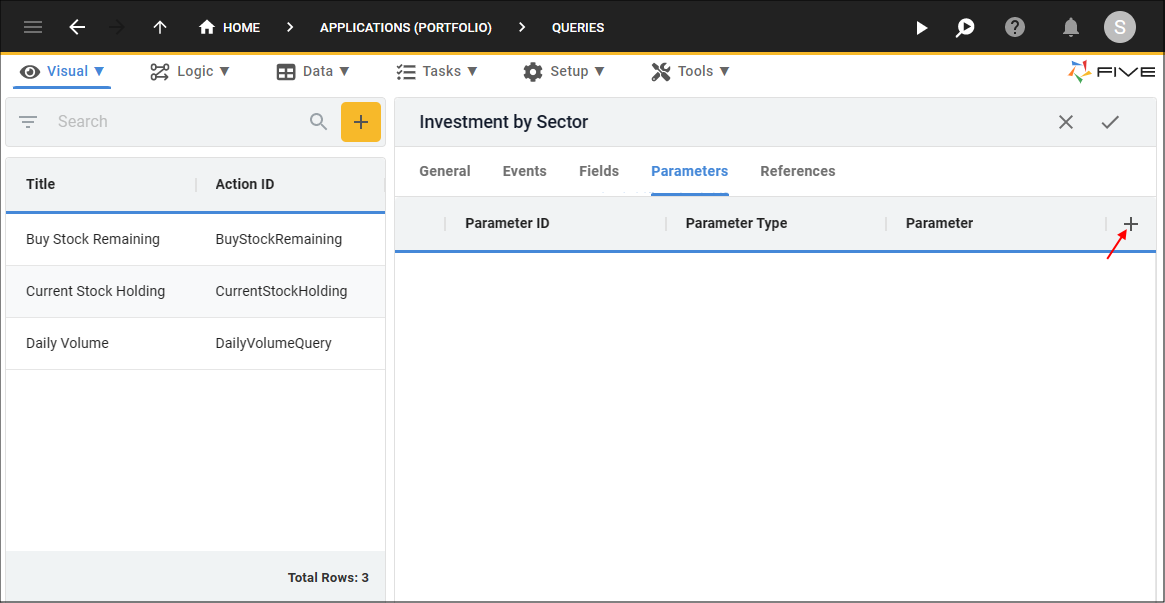
Figure 11 - Add Parameters button
17. Type PortfolioKey in the Parameter ID field.
18. Type {{five.stack.Portfolio.PortfolioKey}} in the Parameter field.
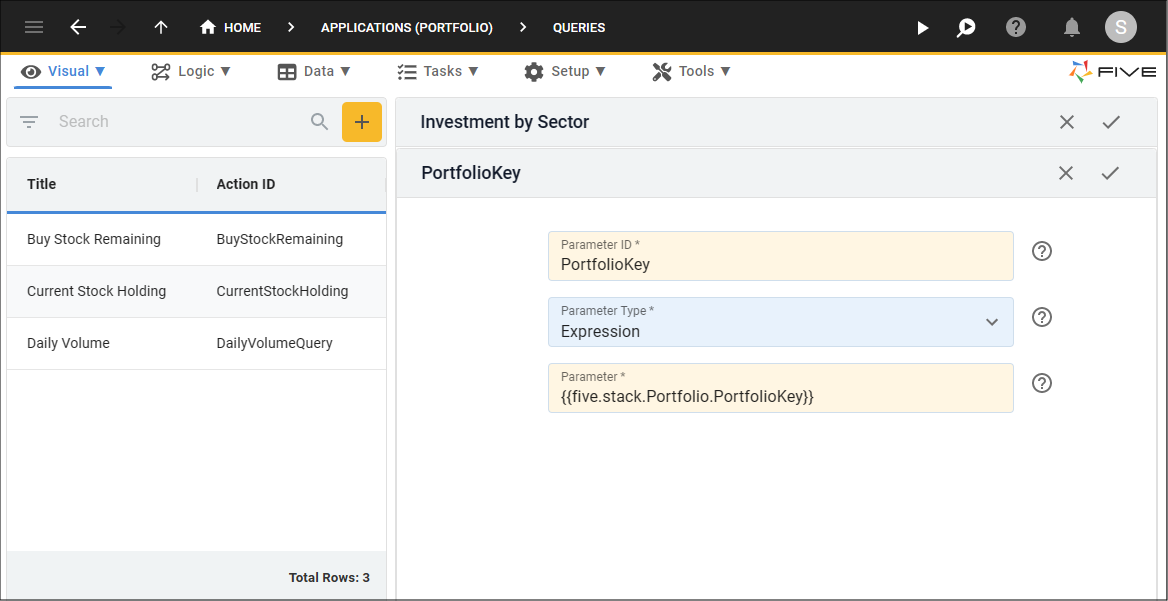
Figure 12 - Add the PortfolioKey parameter
19. Click the Save button in the form app bar.
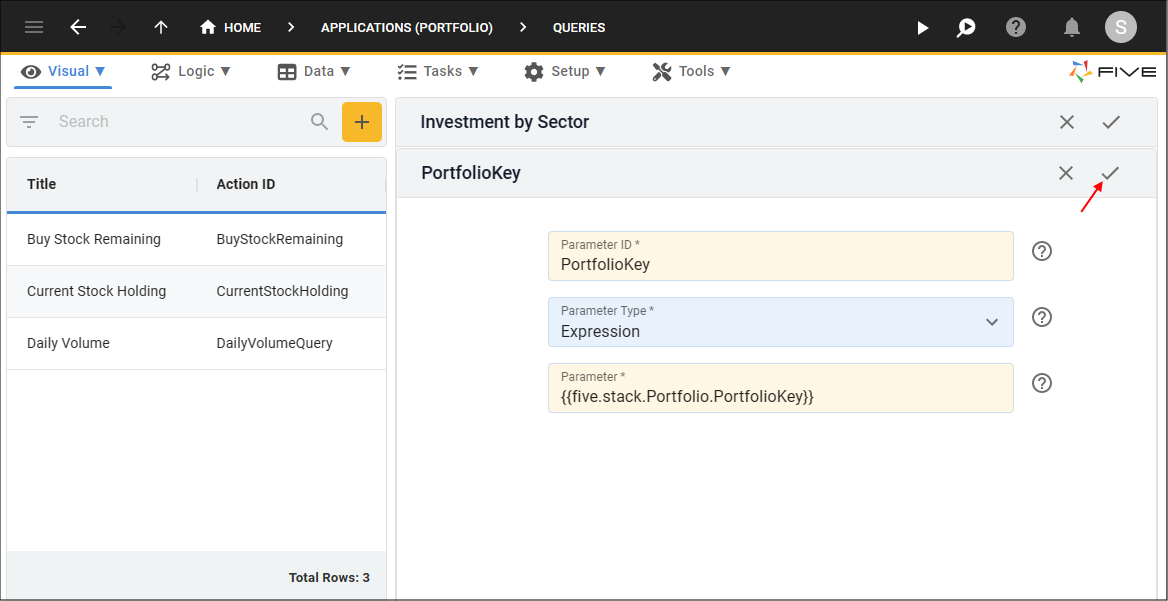
Figure 13 - Save the PortfolioKey parameter
20. Click the Save button in the form app bar above the list.
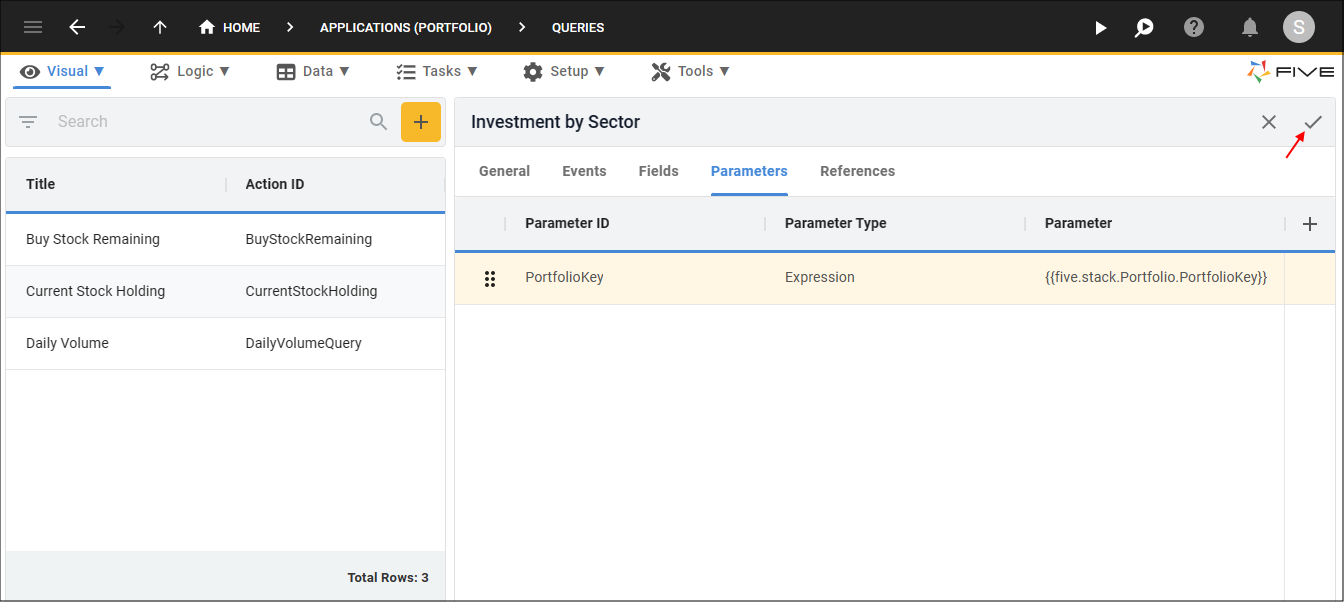
Figure 14 - Save the Investment by Sector query
Add the Investment by Stock Query
1. Click the Add Item button.2. Type Investment by Stock in the Title field.
3. Click in the Query field to open Five's Query Builder.
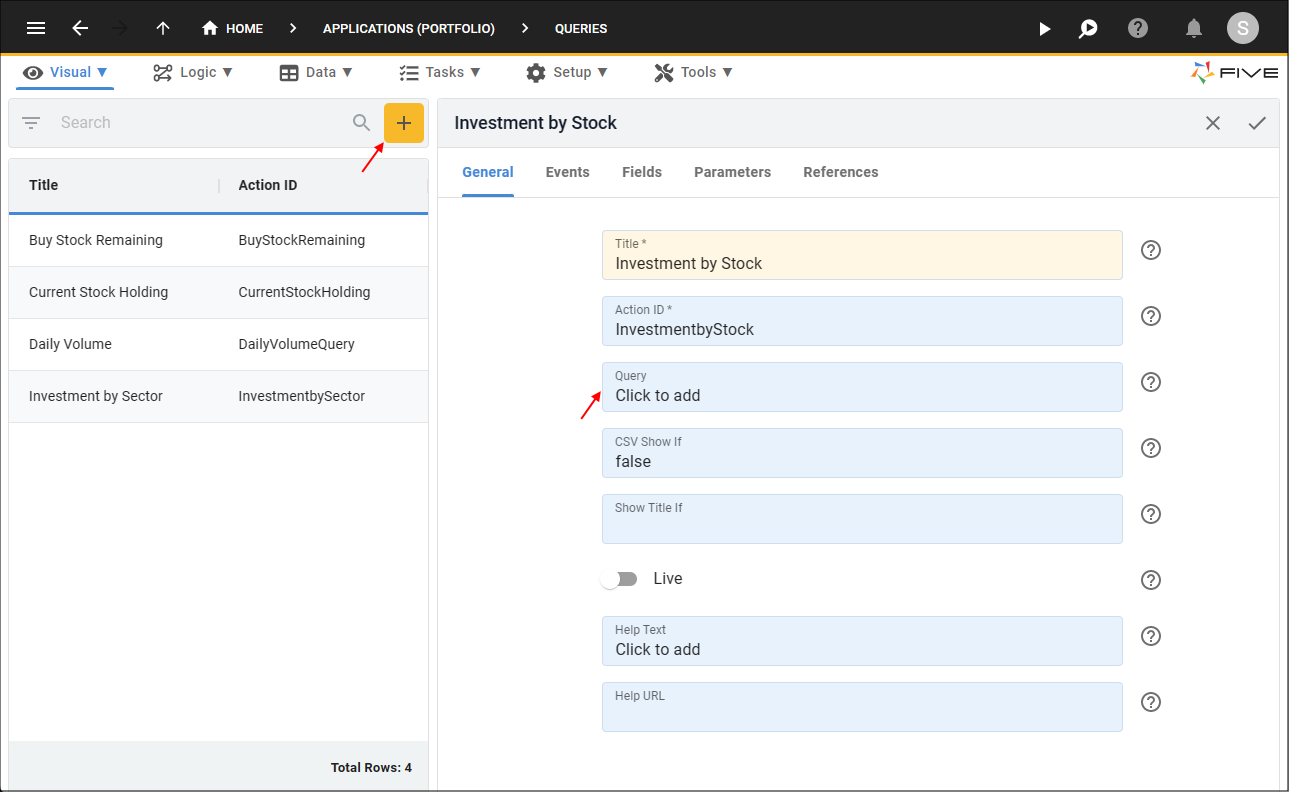
Figure 15 - Add the Investment by Stock query
4. Click the SQL tab.
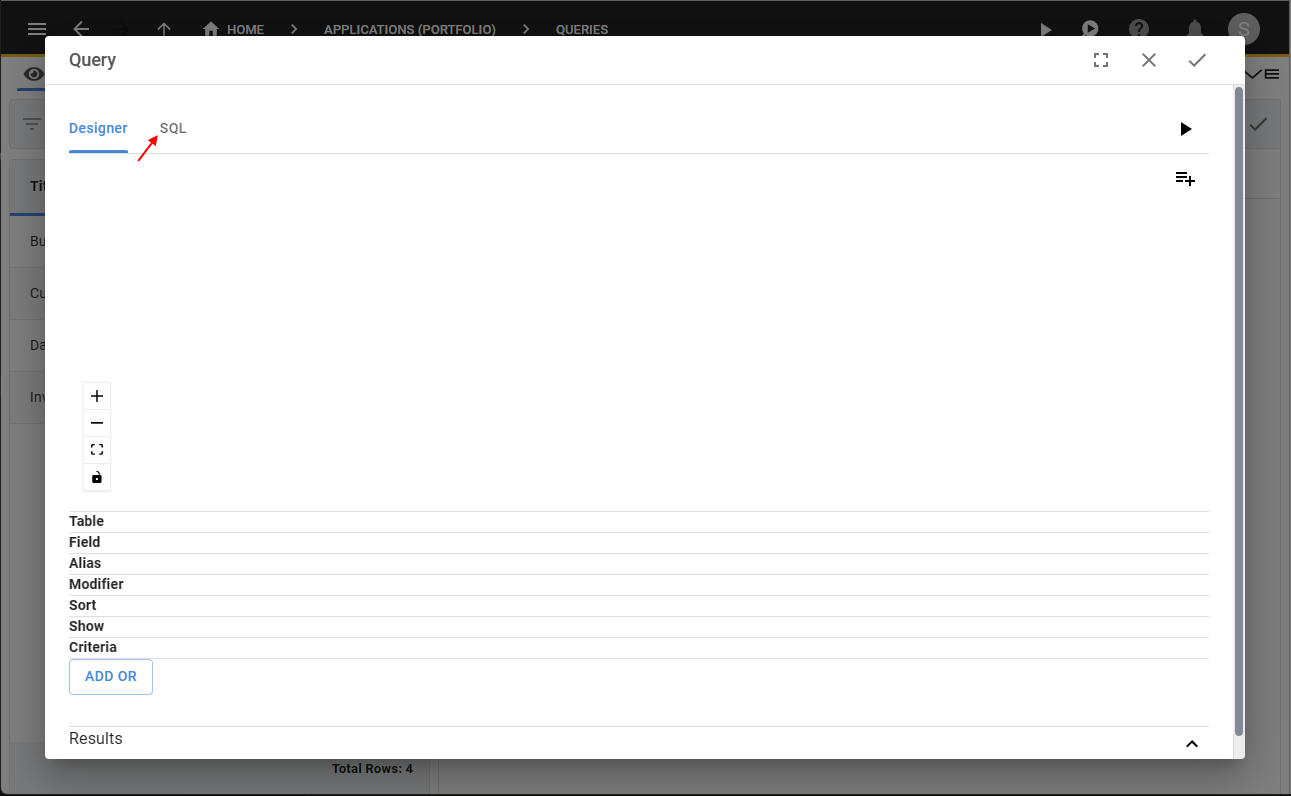
Figure 16 - SQL tab
5. Click the Copy button for the below syntax.
Investment by Stock
SELECT
    Sector,
    StockCode,
    SUM(Bought - Sold) AS Holding,
    SUM(OriginalCost * (Bought - Sold) / Bought) AS Investment
FROM (
    SELECT
        Sector.Name AS Sector,
        Stock.StockCode AS StockCode,
        Buy.PortfolioKey,
        Buy.Quantity AS Bought,
        IFNULL((SELECT SUM(Allocation.Quantity) FROM Allocation WHERE Allocation.BuyKey = Buy.BuyKey),0) AS Sold,
        Buy.Total AS OriginalCost
    FROM
        Buy
        INNER JOIN Stock ON Buy.StockKey = Stock.StockKey
        INNER JOIN Sector ON Stock.SectorKey = Sector.SectorKey
 HAVING
        (Buy.PortfolioKey = ?) AND
        (Bought > Sold)
    ) AS Summary
GROUP BY
    Sector,
    StockCode
6. Paste the syntax in the SQL Editor.
7. Click the Save button in the SQL Editor app bar.
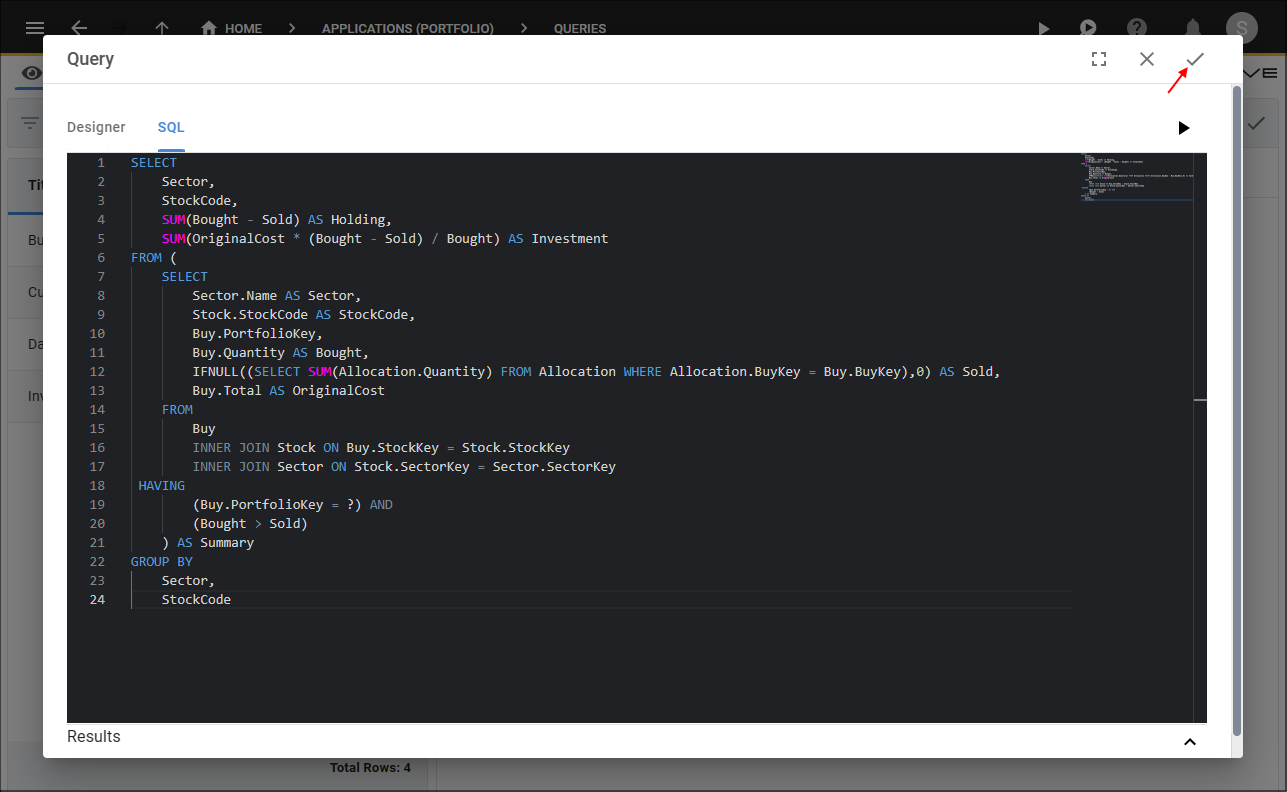
Figure 17 - Save the Investment by Stock syntax
8. Click the Fields tab.
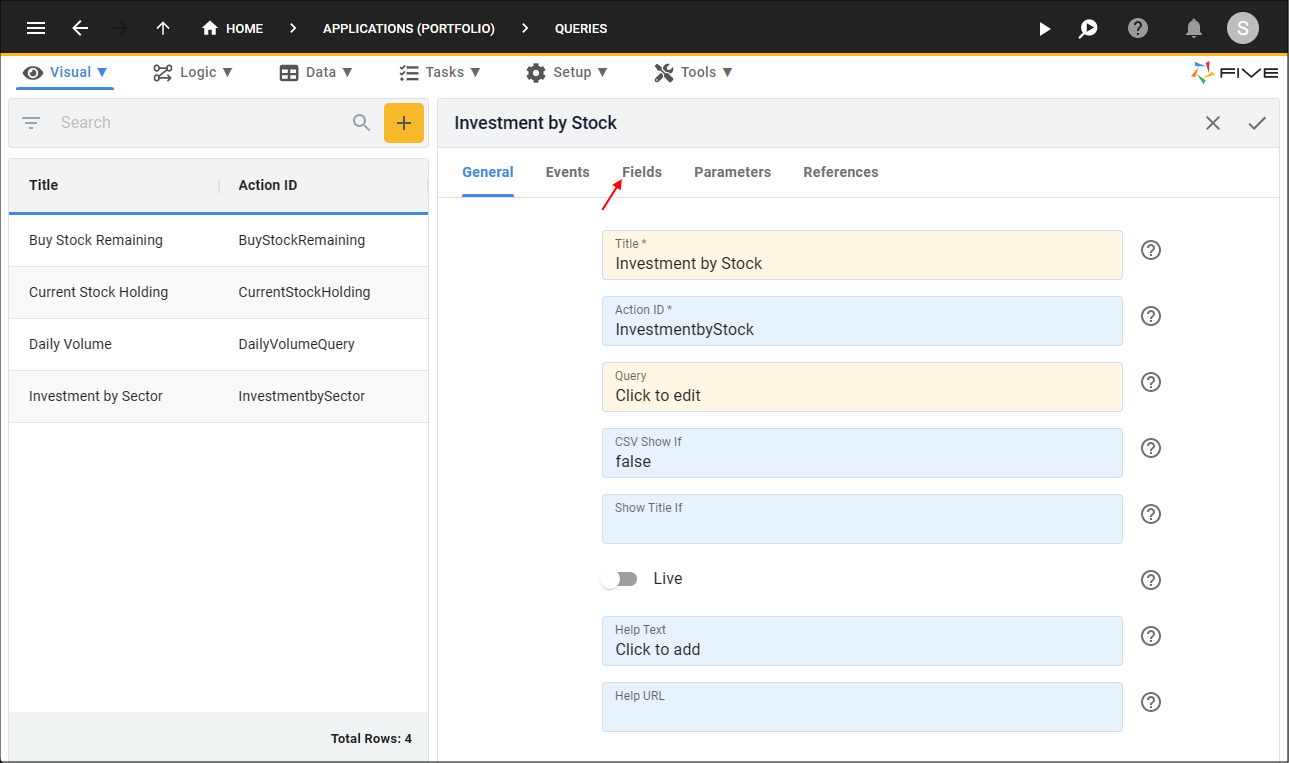
Figure 18 - Fields tab
9. Select the Holding record.
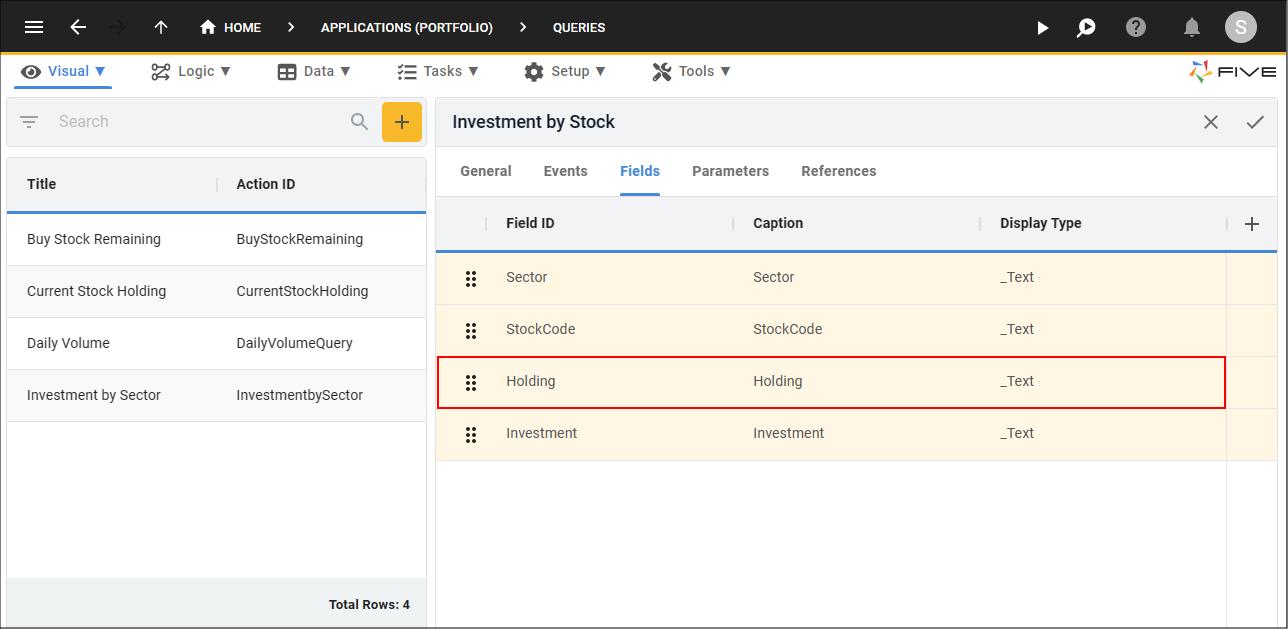
Figure 19 - Holding record
10. Click the lookup icon in the Display Type field and select _Integer.
11. Click the Save button in the form app bar.
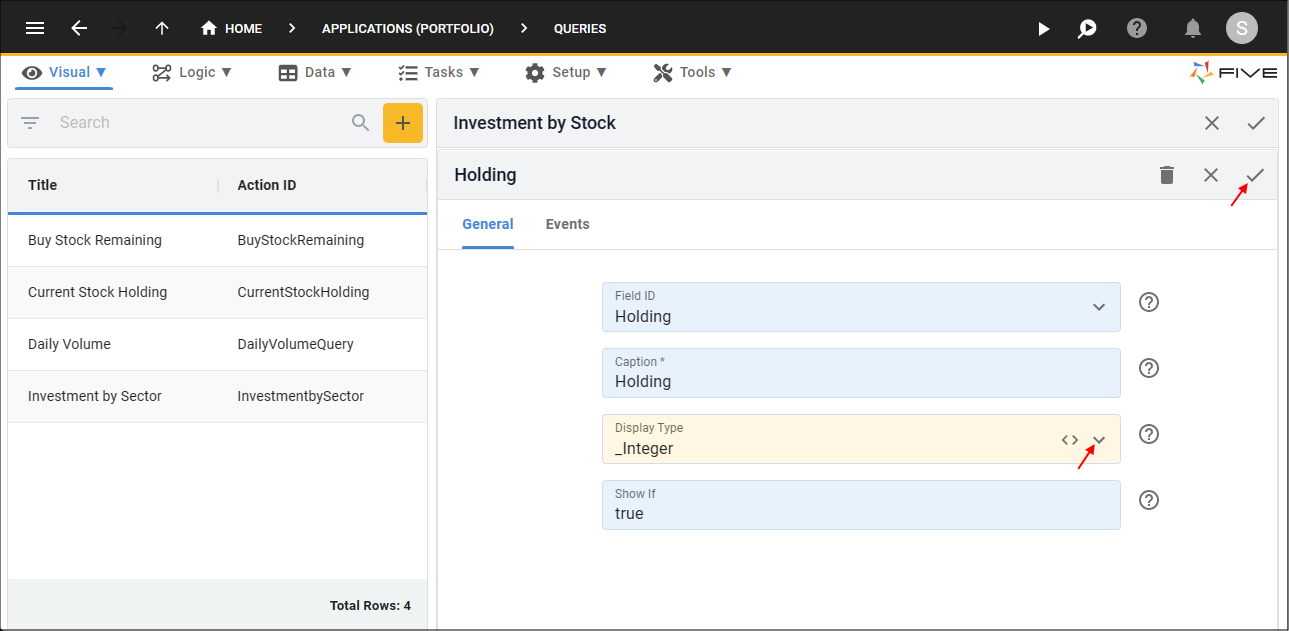
Figure 20 - Edit the Holding record
12. Select the Investment record.
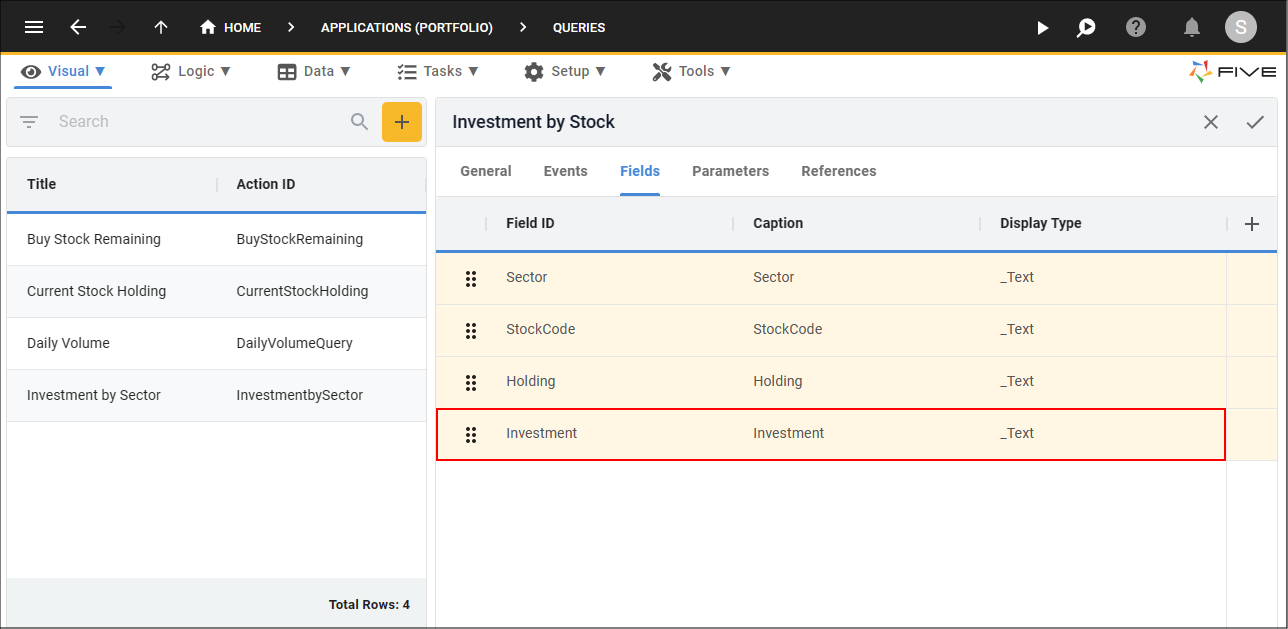
Figure 21 - Investment record
13. Click the lookup icon in the Display Type field and select _Currency.
14. Click the Save button in the form app bar.
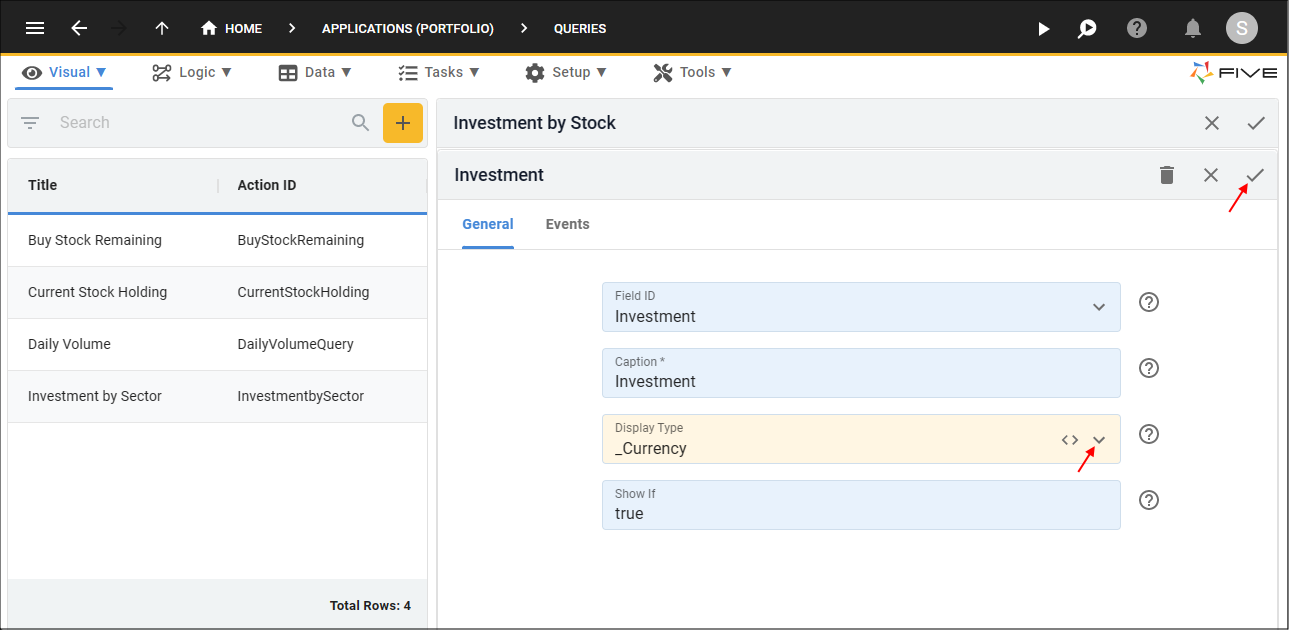
Figure 22 - Edit the Investment record
15. Click the Parameters tab.
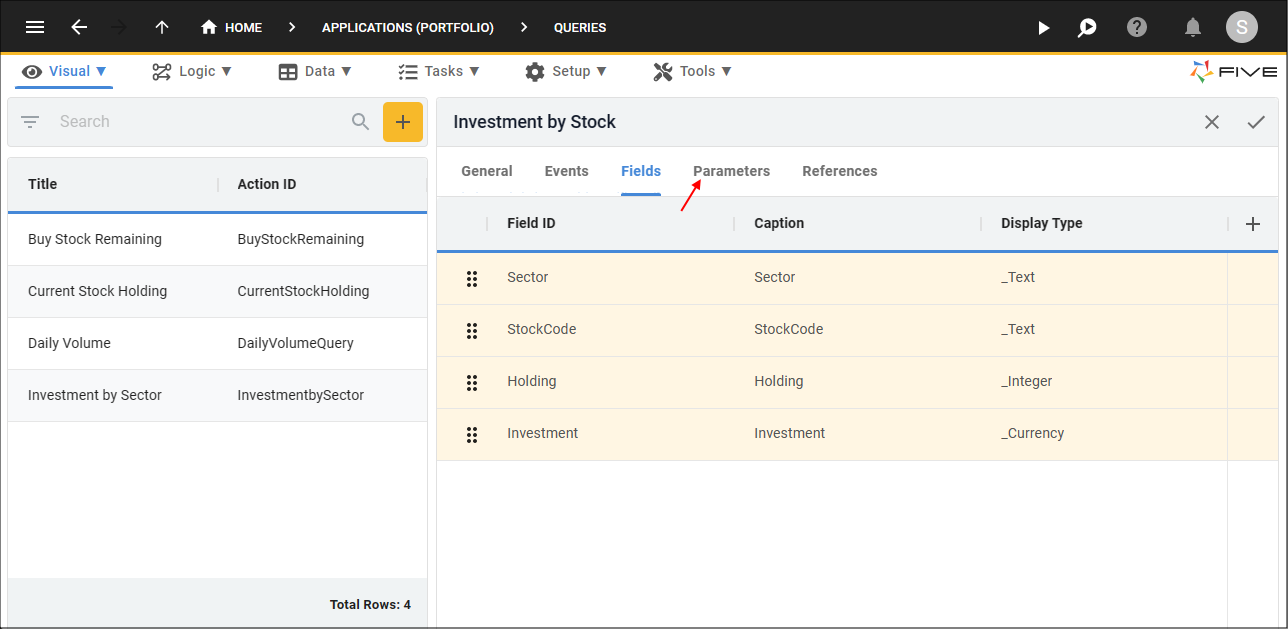
Figure 23 - Parameters tab
16. Click the Add Parameters button.
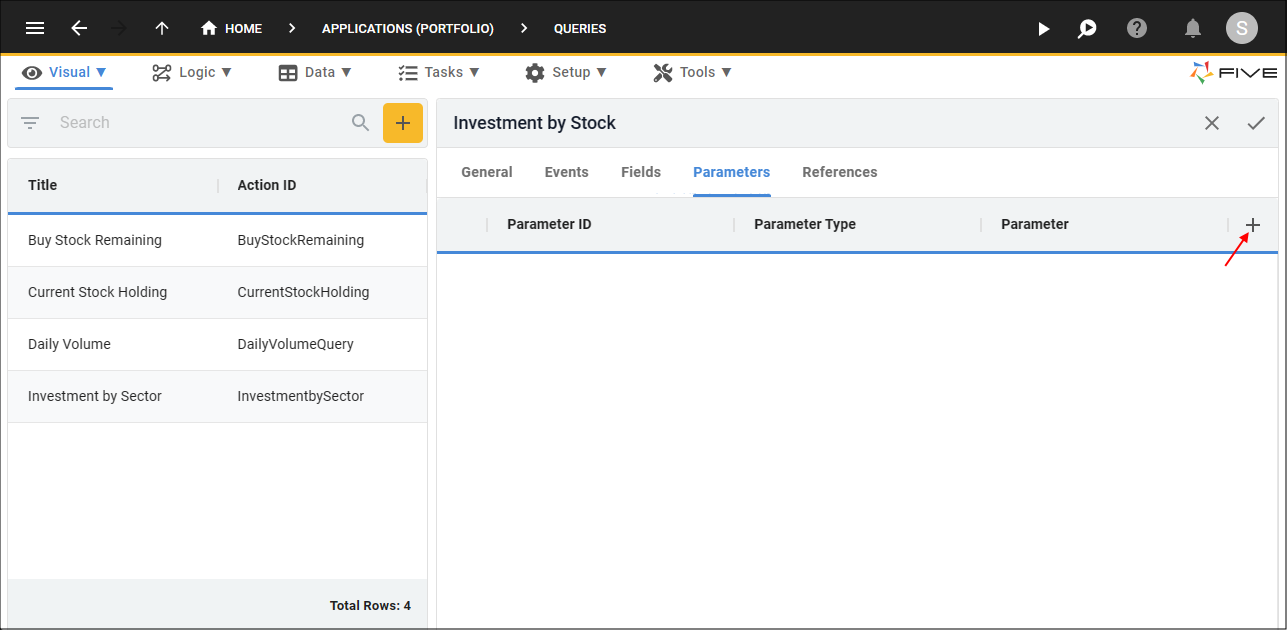
Figure 24 - Add Parameters button
17. Type PortfolioKey in the Parameter ID field.
18. Type {{five.stack.Portfolio.PortfolioKey}} in the Parameter field.
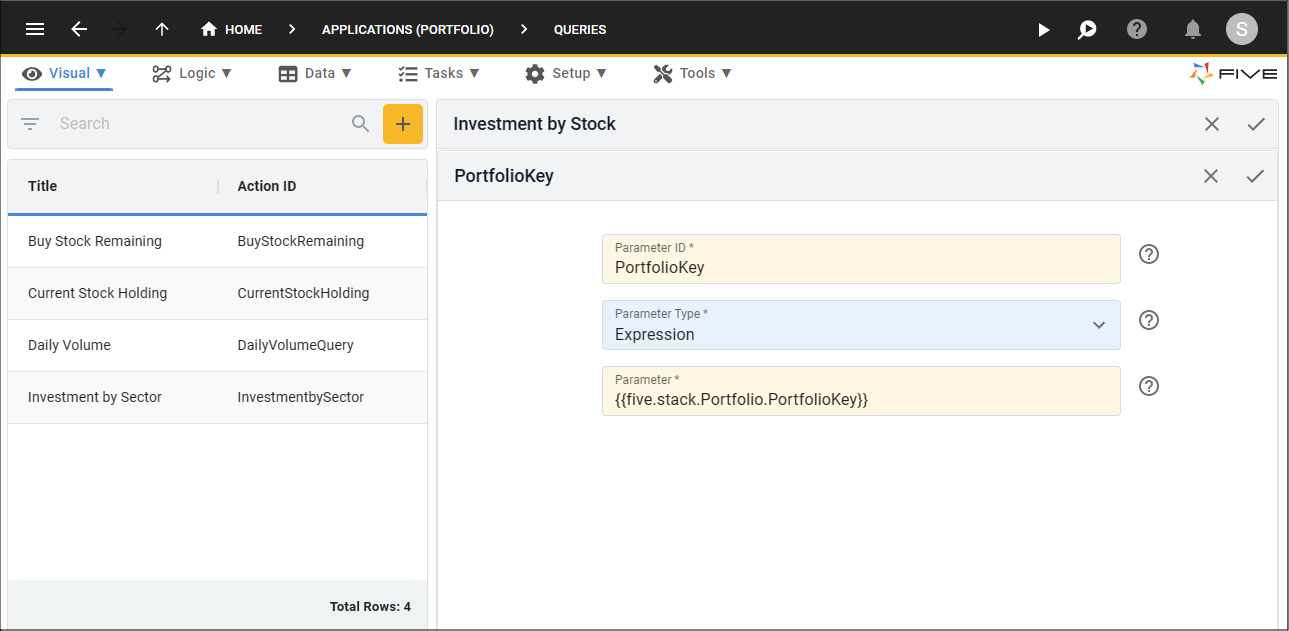
Figure 25 - Add the PortfolioKey parameter
19. Click the Save button in the form app bar.
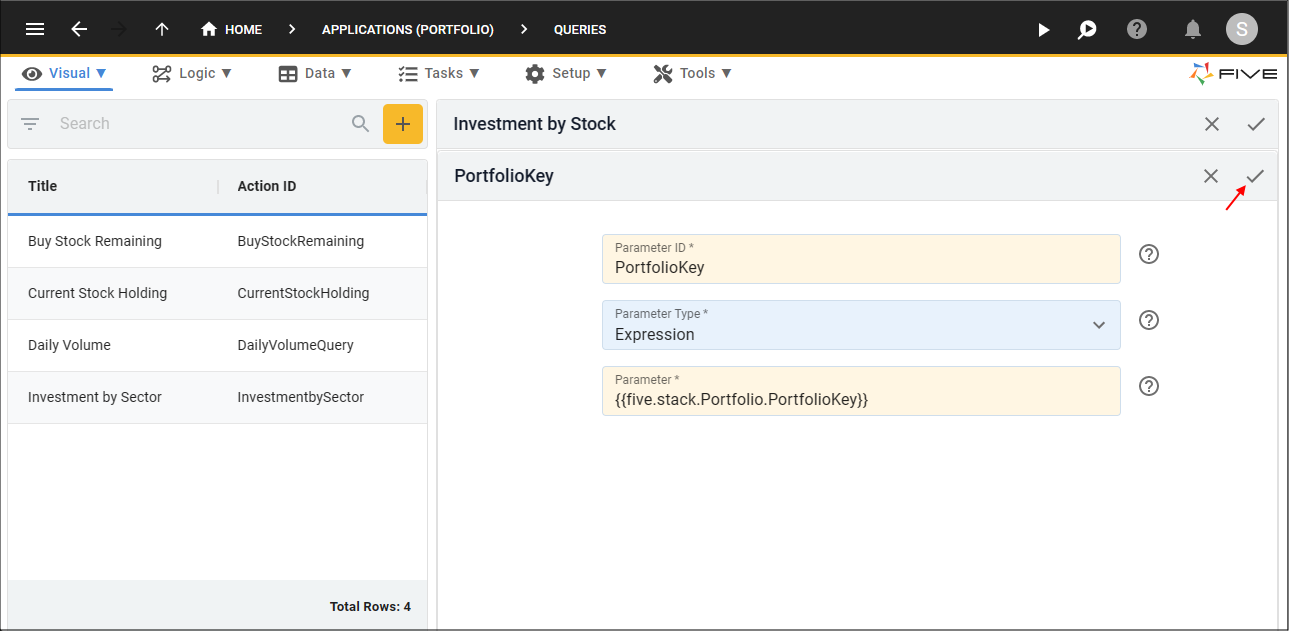
Figure 26 - Save the PortfolioKey parameter
20. Click the Save button in the form app bar above the list.
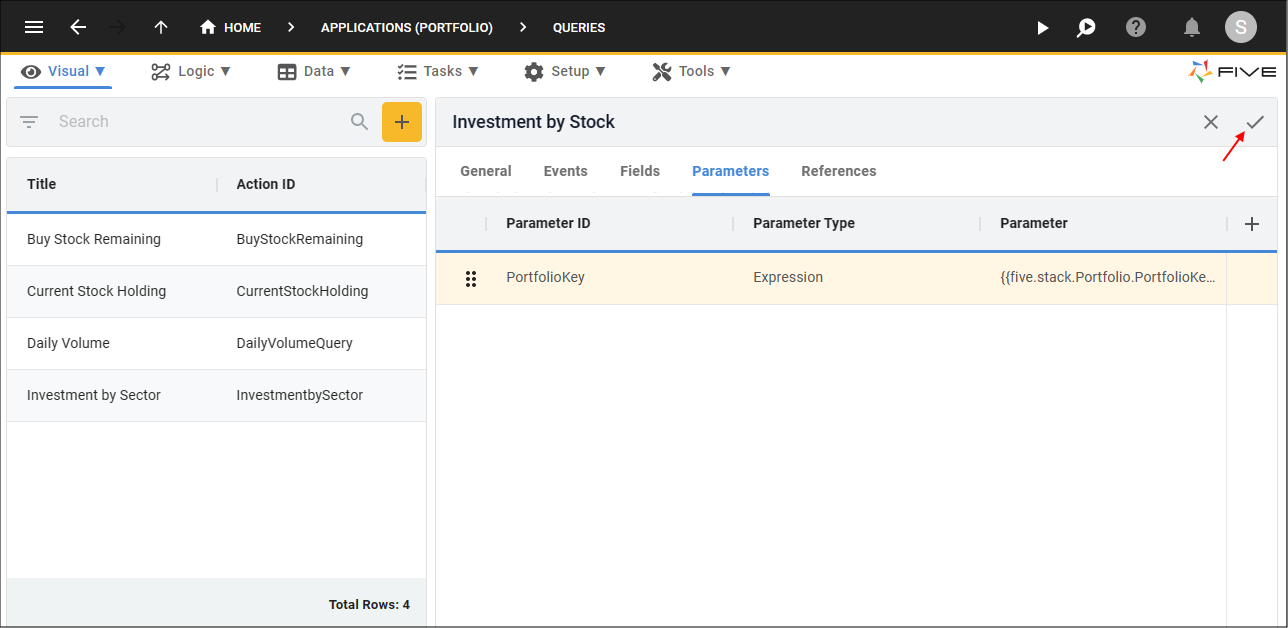
Figure 27 - Save the Investment by Stock query
Navigate to Charts
1. Select Visual in the menu.2. Select Charts in the sub-menu.
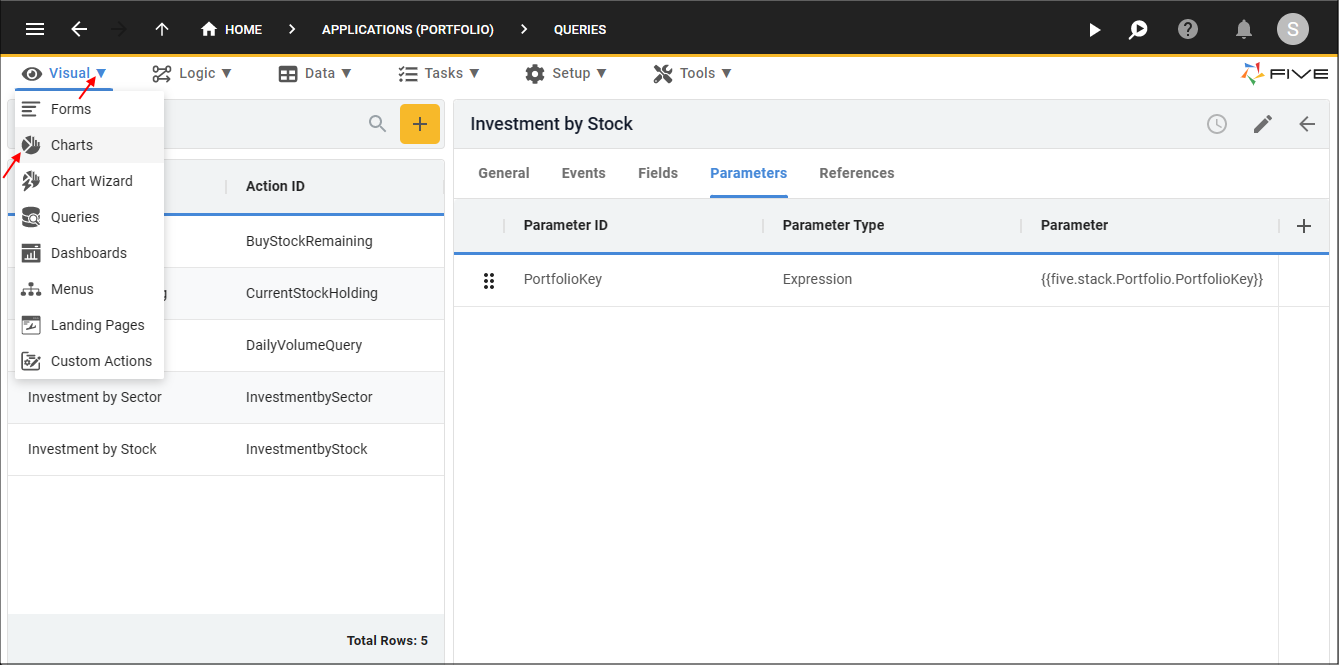
Figure 28 - Charts menu item
Add the Investment Analysis Chart
1. Click the Add Item button.2. Type Investment Analysis in the Title field.
3. Type 2 in the Columns field.
4. Type true in the Show Title If field.
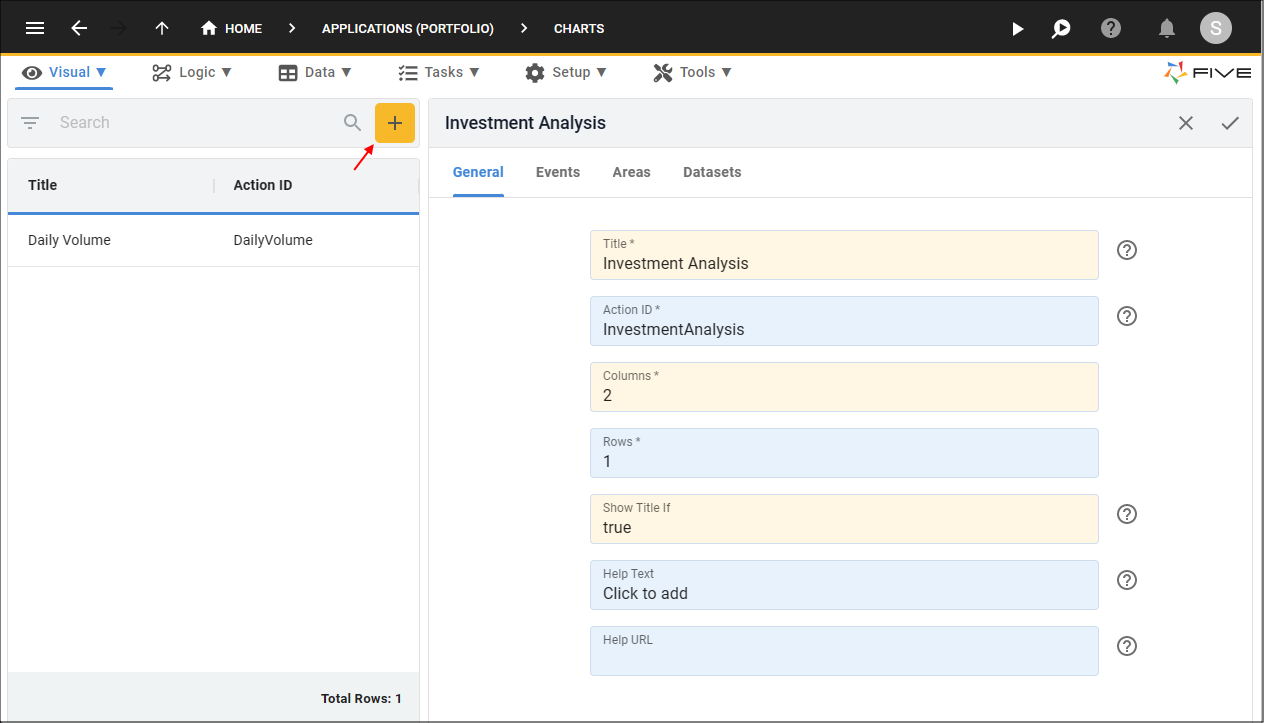
Figure 29 - Add the Investment Analysis chart
Add the Investment by Sector Area
5. Click the Areas tab.
Figure 30 - Areas tab
6. Click the Add Areas button.
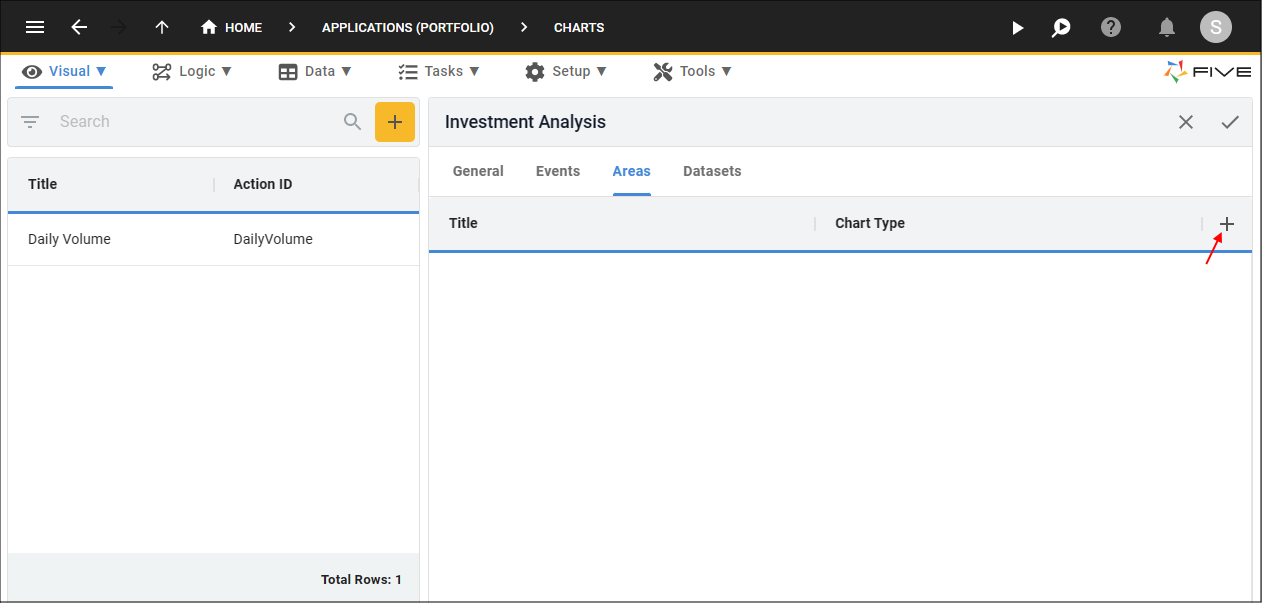
Figure 31 - Add Areas button
7. Type Investment by Sector in the Title field.
8. Type true in the Show Title If field.
9. Click the lookup icon in the Chart Type field and select Pie.
10. Click the Edit button in the Page Position field to open the Grid Picker.
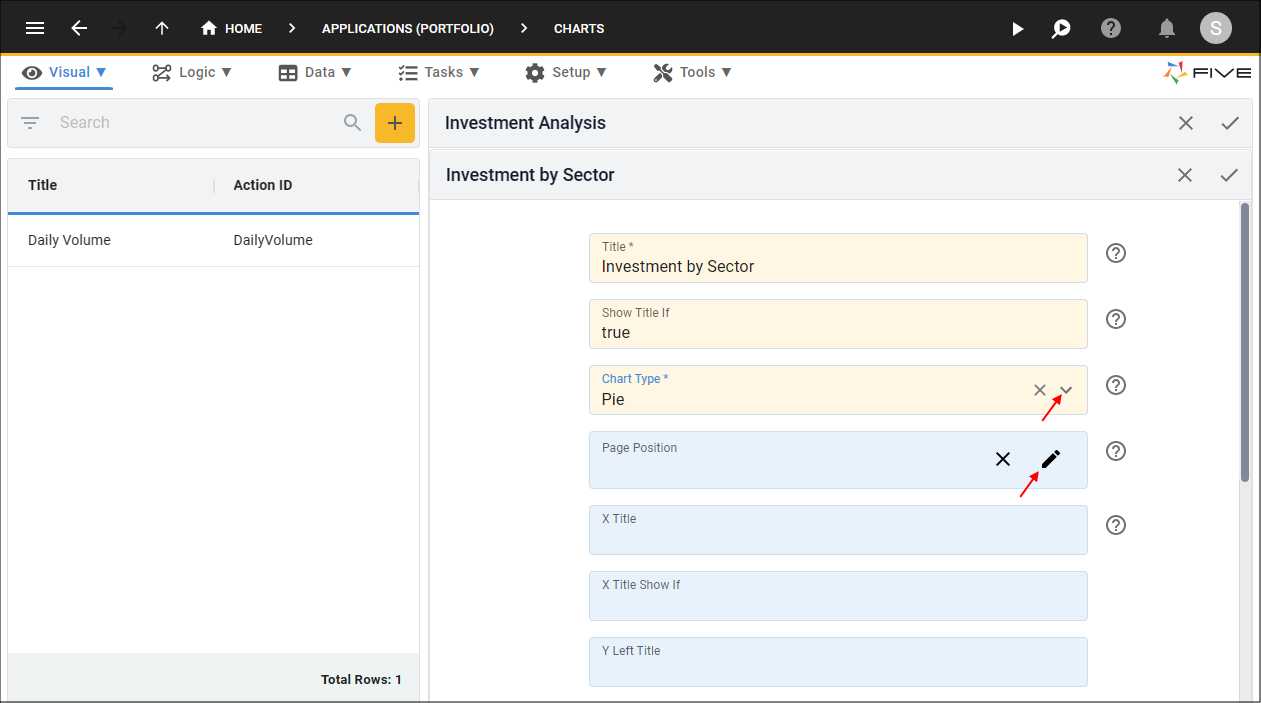
Figure 32 - Add the Investment by Sector area
11. Select the A1 position.
12. Click the Save button in the Grid Picker
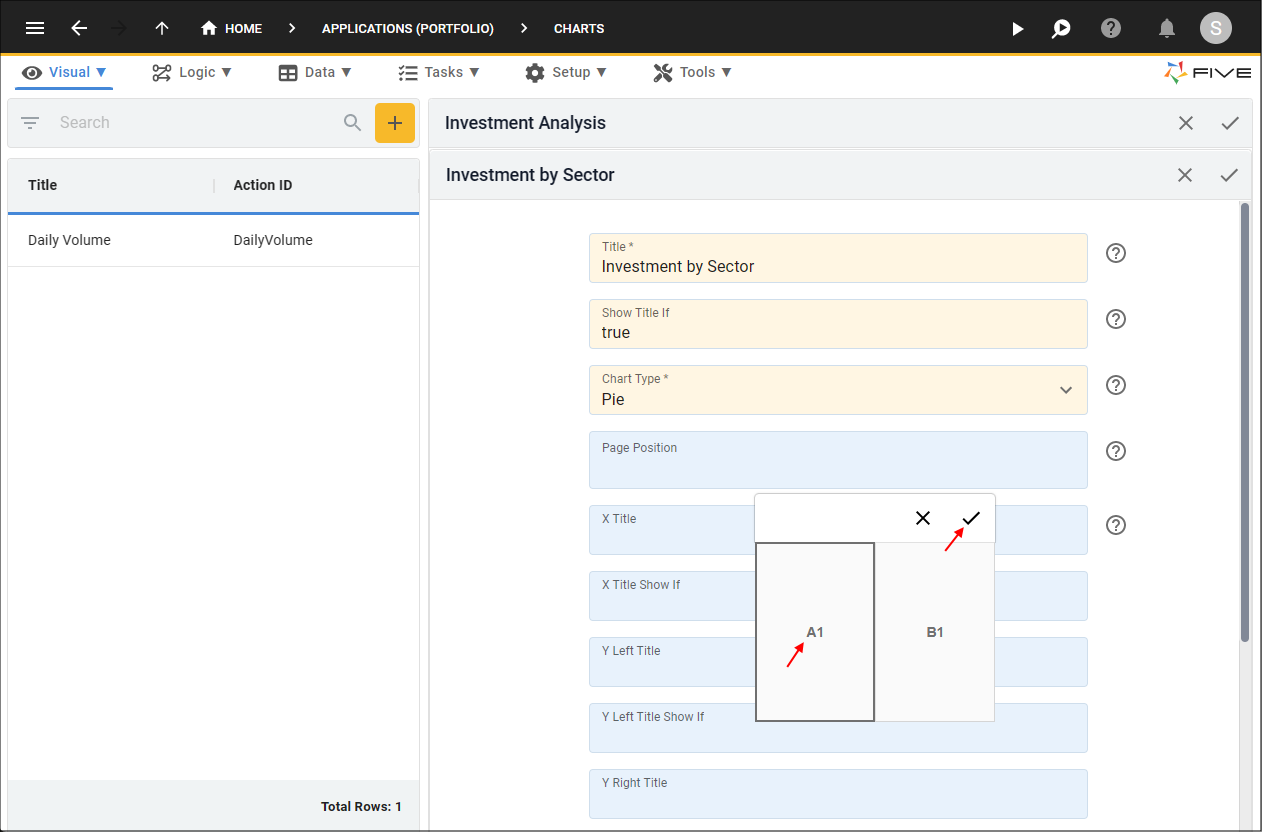
Figure 33 - Select the A1 position
13. Type true in the Legend Show If field.
14. Click in the Color List field to open the Color Picker.
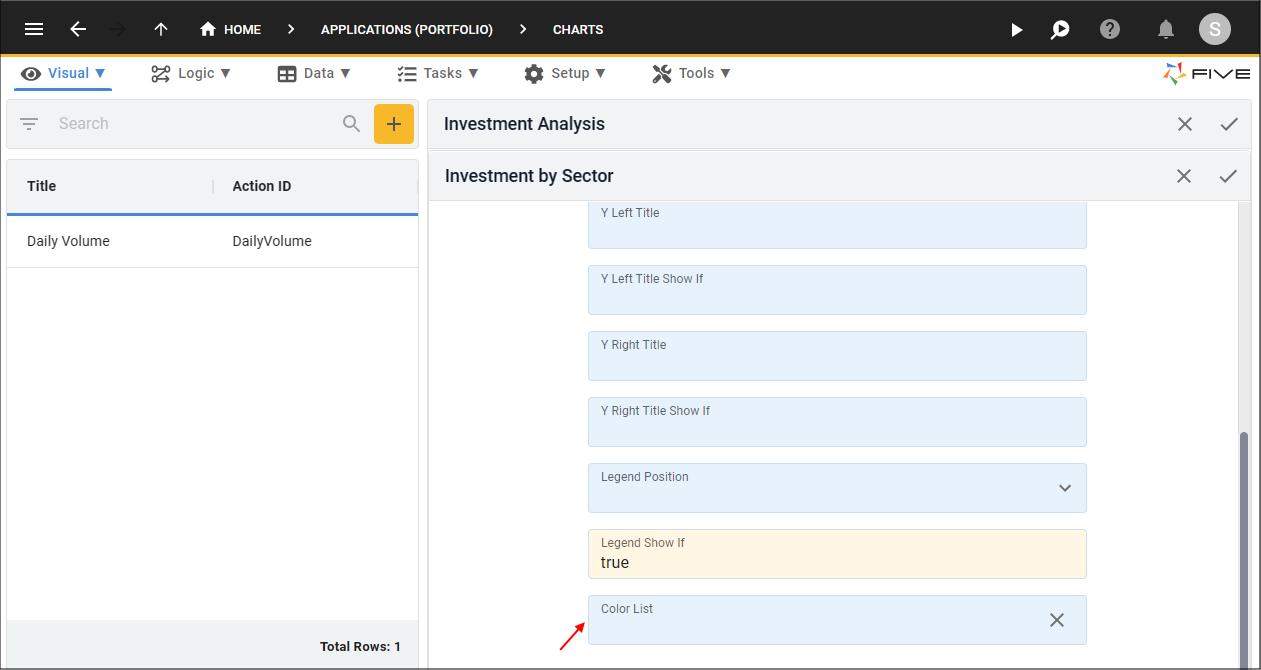
Figure 34 - Open the Color Picker
15. Click a color square.
16. Click the Add New Color button.
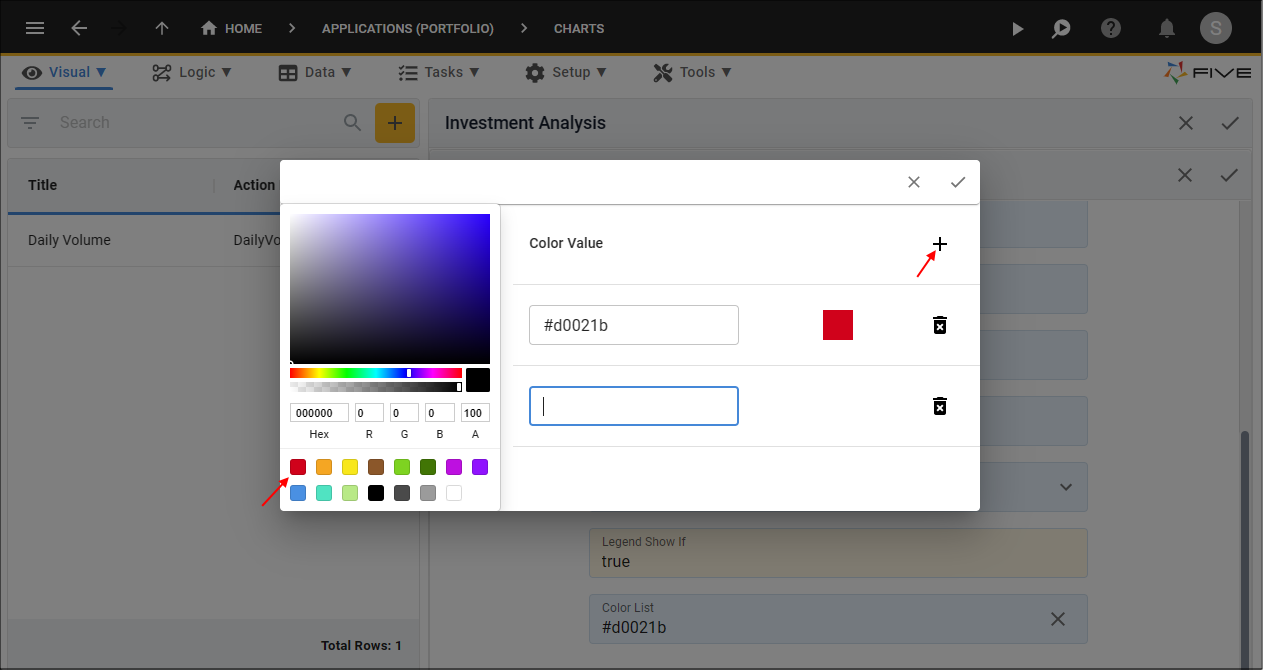
Figure 35 - Select colors
17. Repeat steps 10 and 11 to add four more colors.
18. Click the Save button in the Color Picker.
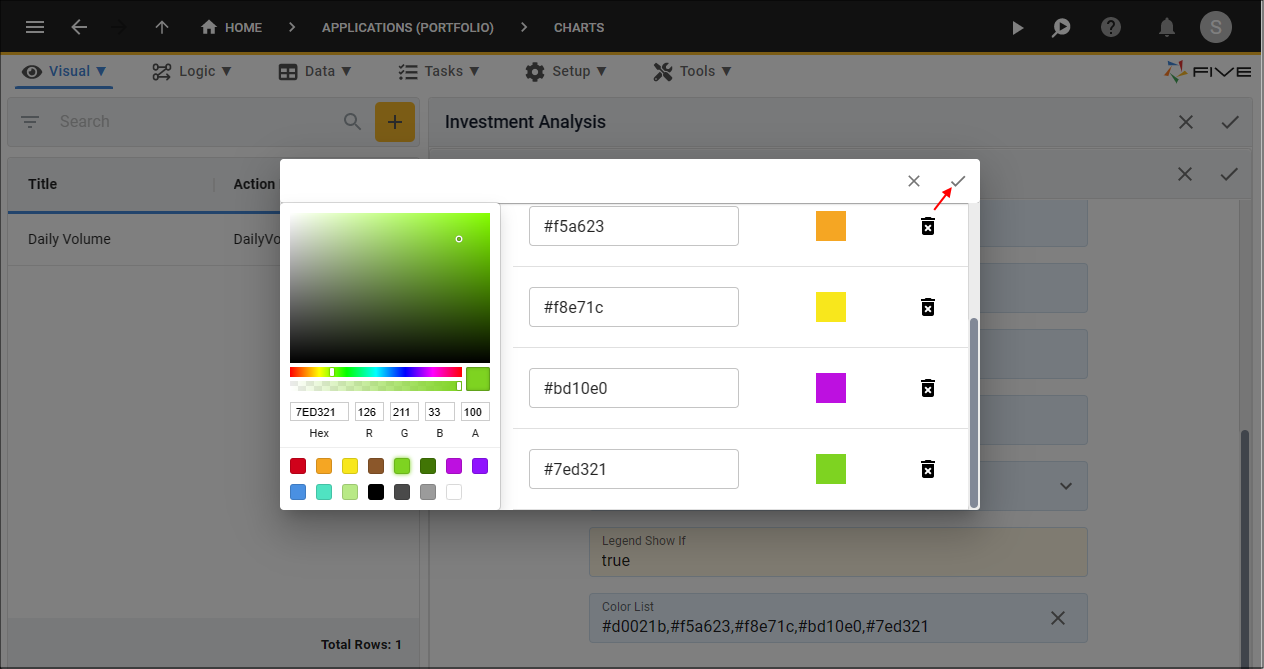
Figure 36 - Save colors
19. Click the Save button in the form app bar.
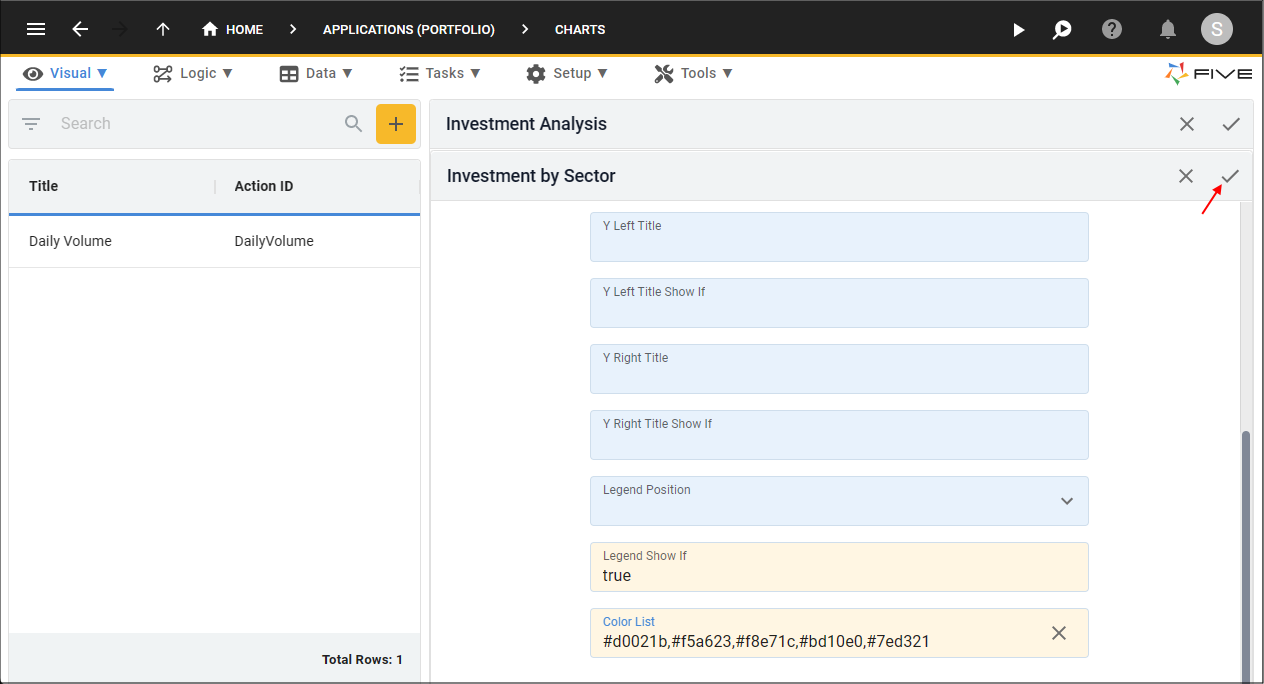
Figure 37 - Save the Investment by Sector area
Add the Investment by Sector Dataset
20. Click the Datasets tab.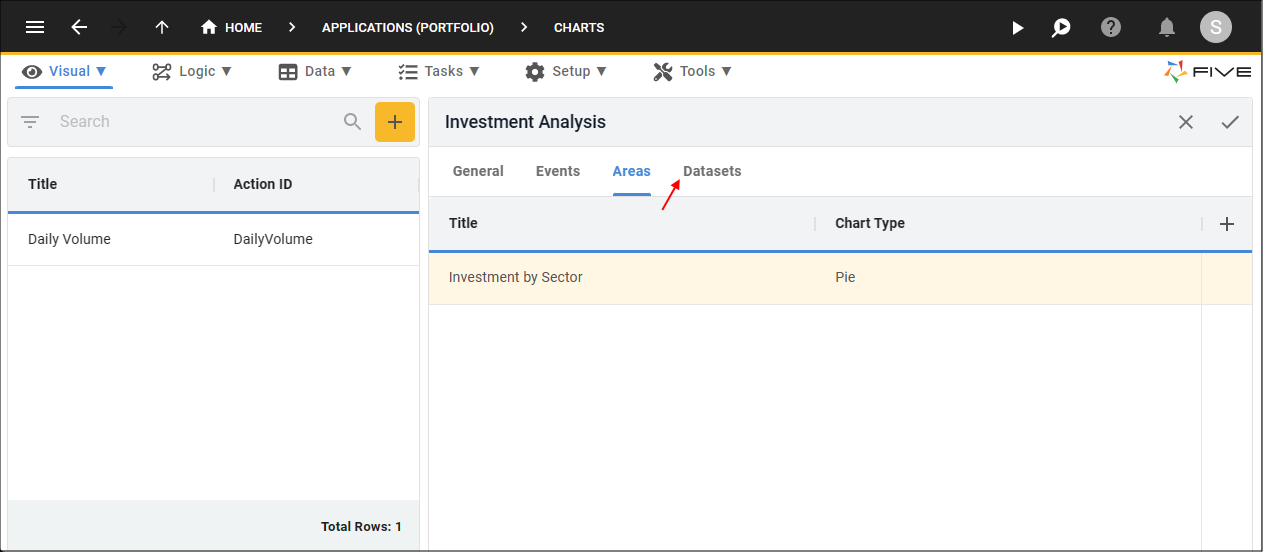
Figure 38 - Datasets tab
21. Click the Add Datasets button.
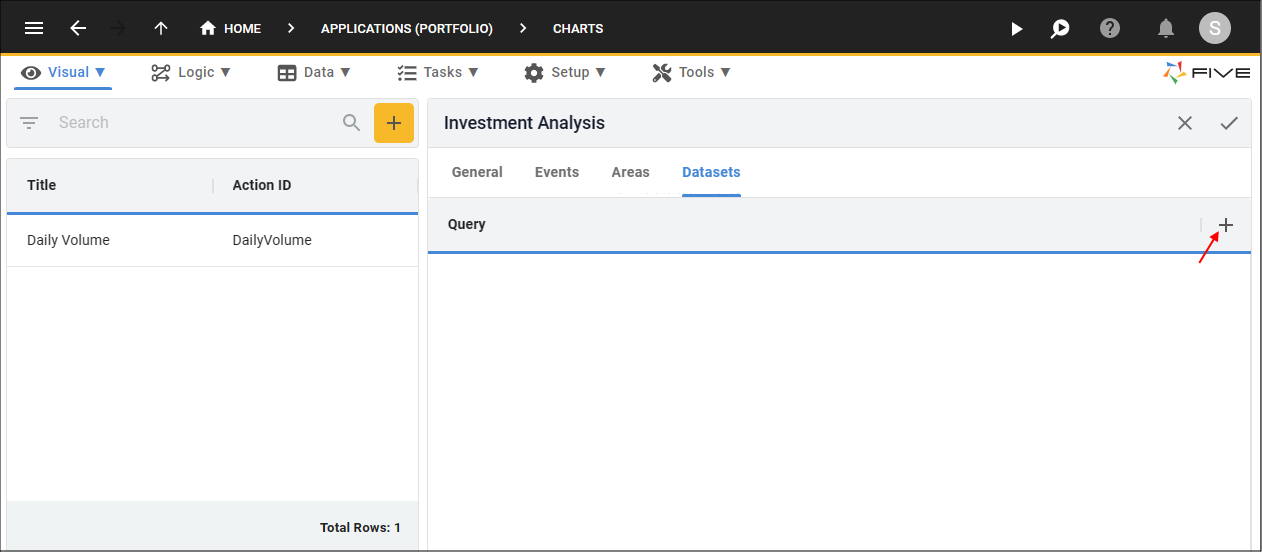
Figure 39 - Add Datasets button
22. Click the lookup icon in the query field and select InvestmentbySector.

Figure 40 - Add the InvestmentbySector dataset
23. Click the Chart Area Datasets tab.

Figure 41 - Chart Area Datasets tab
24. Click the Add Chart Area Datasets button.
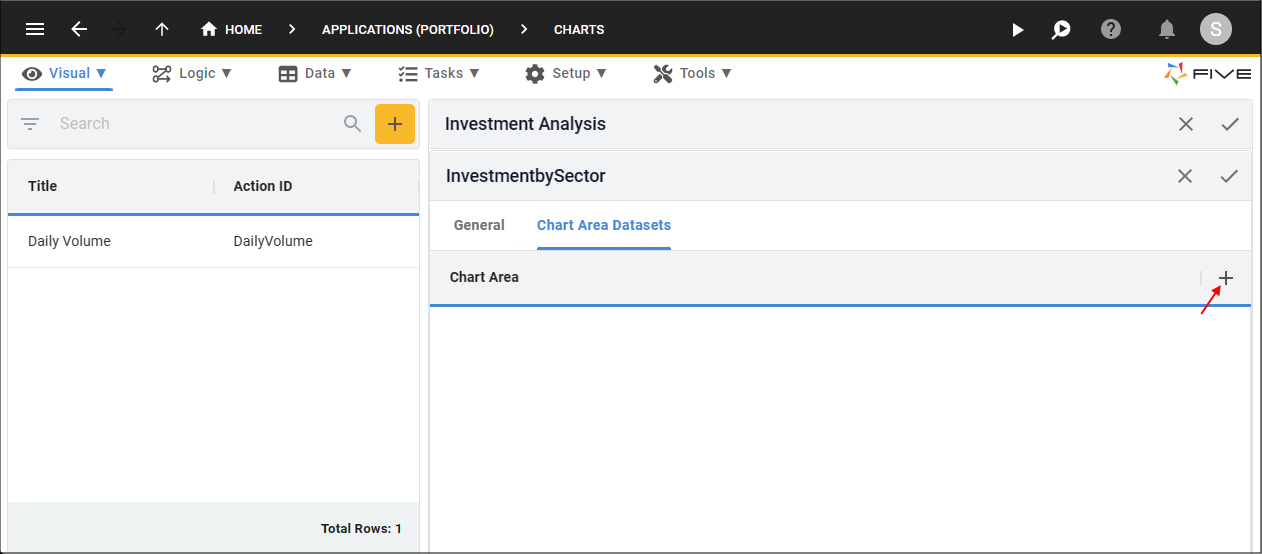
Figure 42 - Add Chart Area Datasets button
25. Click the lookup icon in the Chart Area field and select Investment by Sector.
26. Click the lookup icon in the X Value Column and select Sector.
27. Click the lookup icon in the Y Value Column and select Investment.
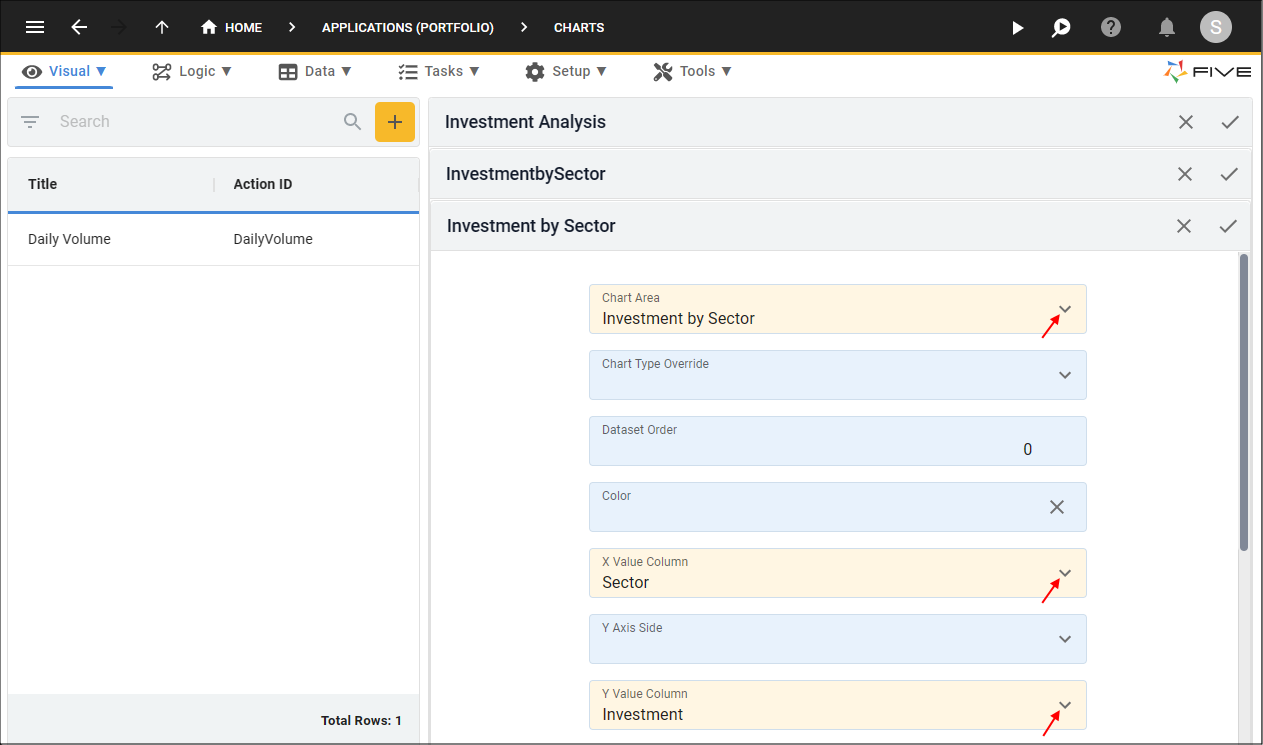
Figure 43 - Add the Investment by Sector chart area dataset
28. Click the Save button in the form app bar.
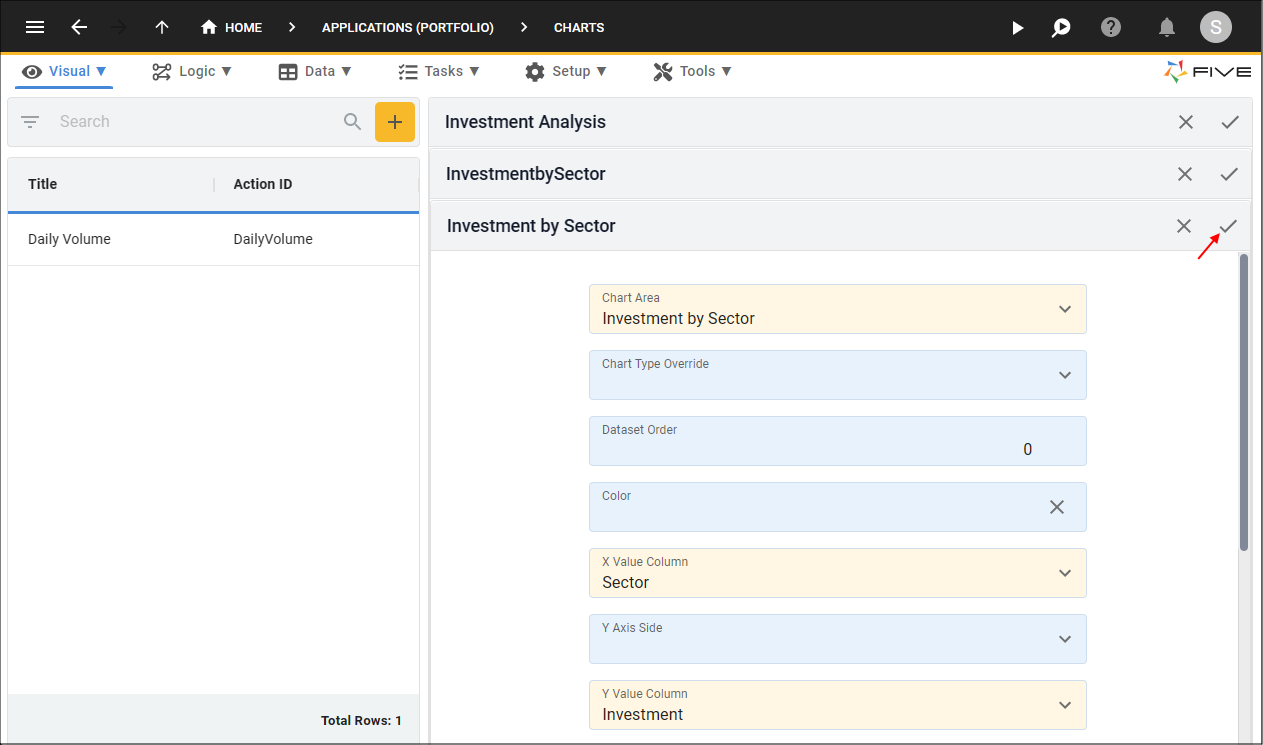
Figure 44 - Save the Investment by Sector chart area dataset
29. Click the Save button in the form app bar above the list.
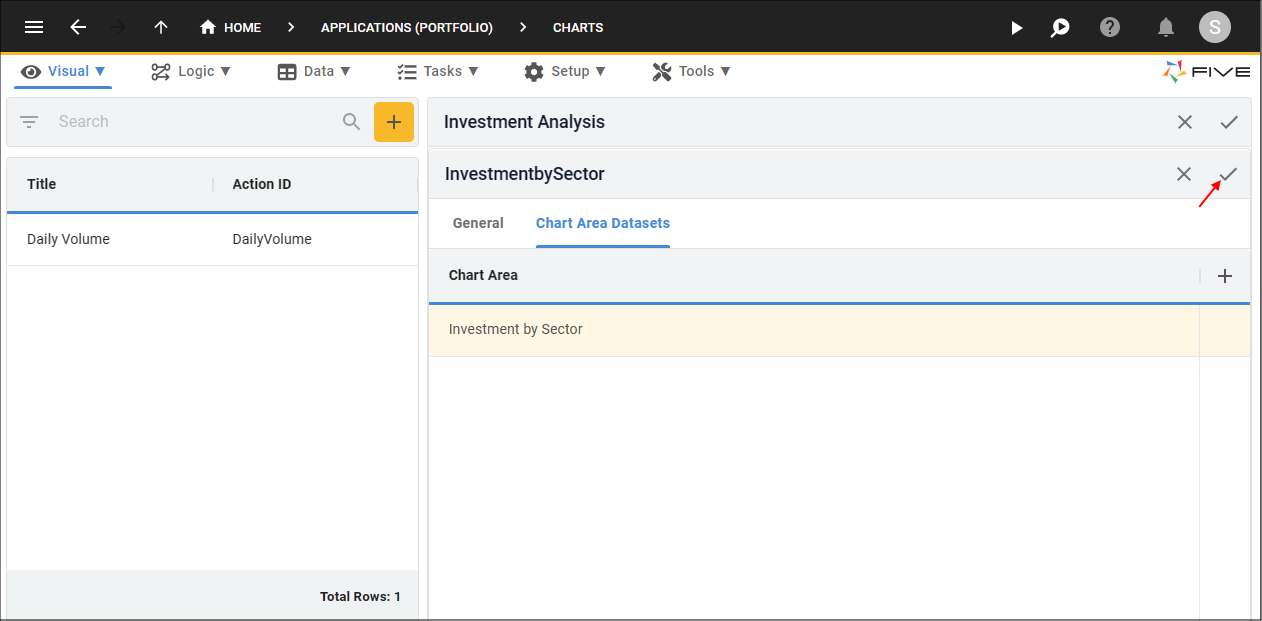
Figure 45 - Save the Investment by Sector chart area
info
The above steps need to be repeated to add the Investment by Stock area.
Add the Investment by Stock Area
30. Click the Areas tab.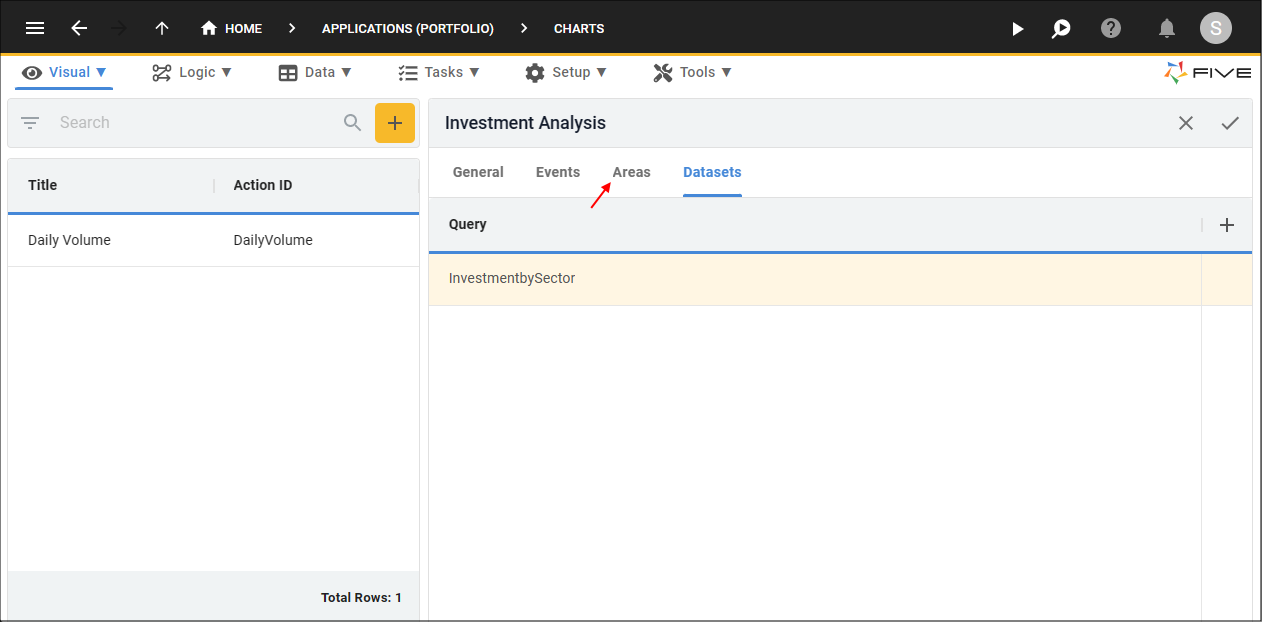
Figure 46 - Areas tab
31. Click the Add Areas button.
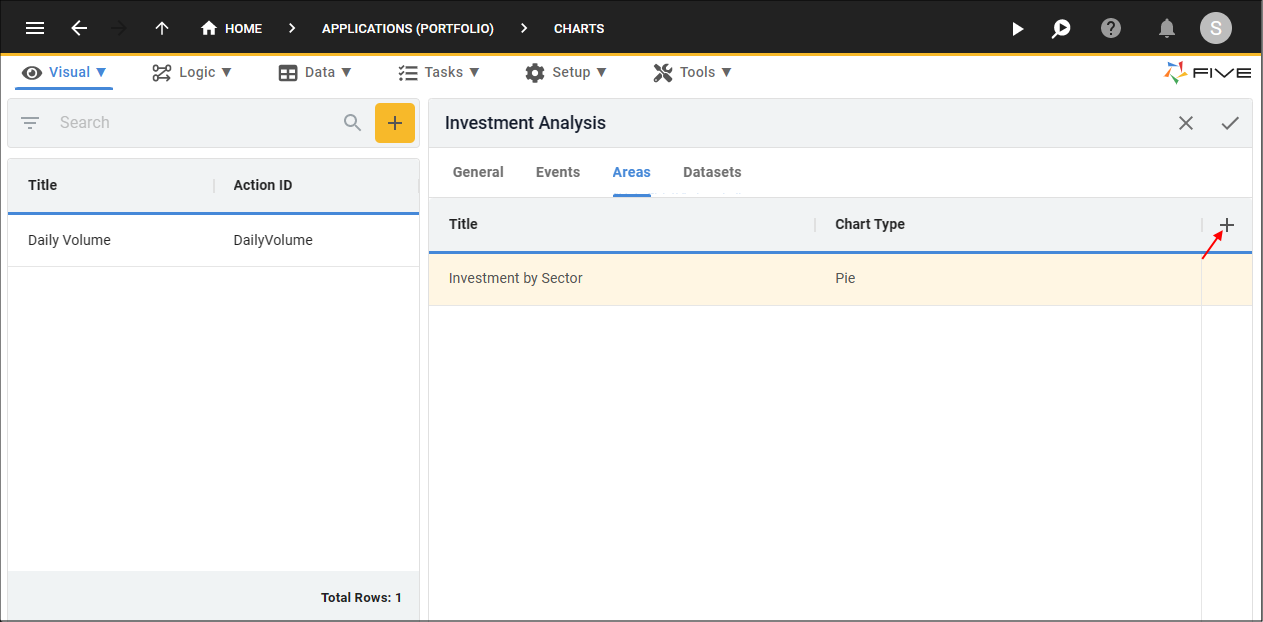
Figure 47 - Add Areas button
32. Type Investment by Stock in the Title field.
33. Type true in the Show Title If field.
34. Click the lookup icon in the Chart Type field and select Pie.
35. Click the Edit button in the Page Position field to open the Grid Picker.
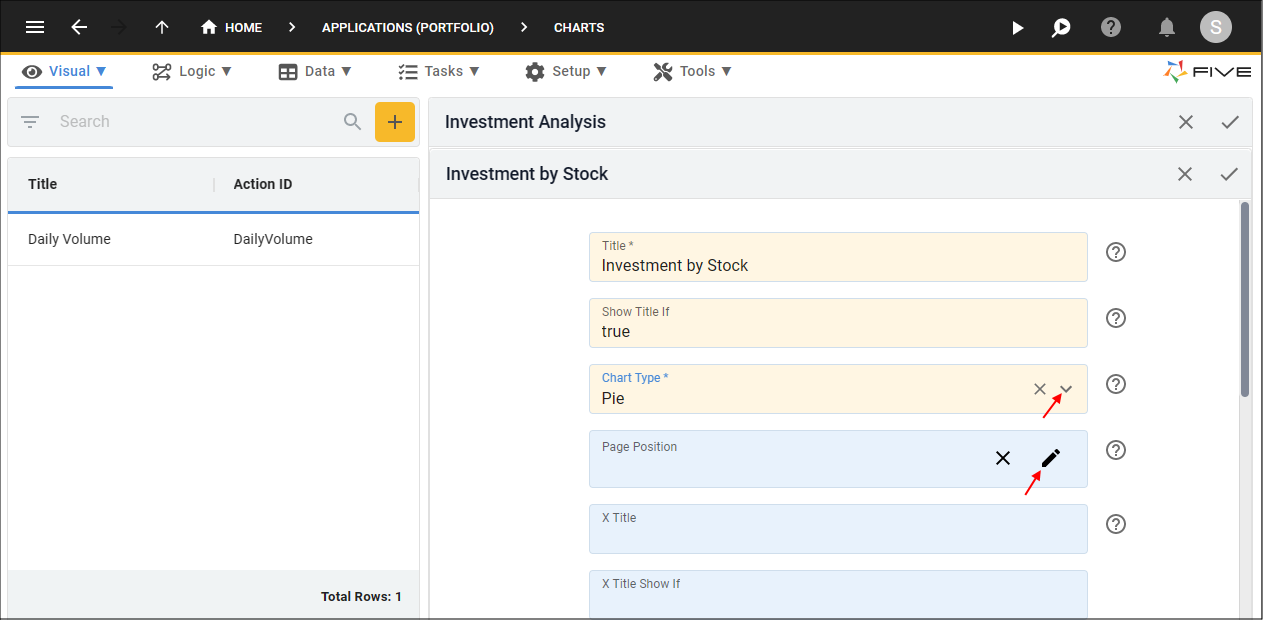
Figure 48 - Add the Investment by Stock area
36. Select the B1 position.
37. Click the Save button in the Grid Picker
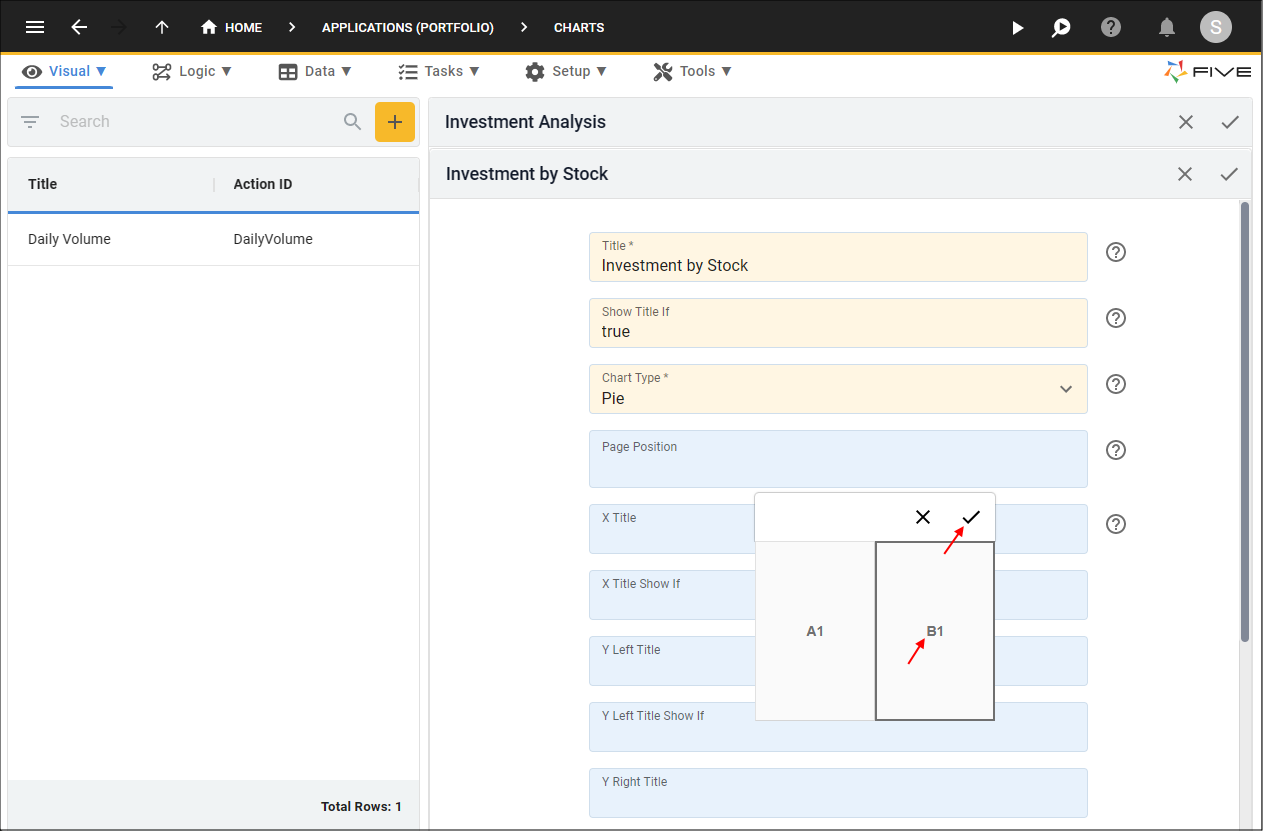
Figure 49 - Select the B1 position
38. Type true in the Legend Show If field.
39. Click in the Color List field to open the Color Picker.
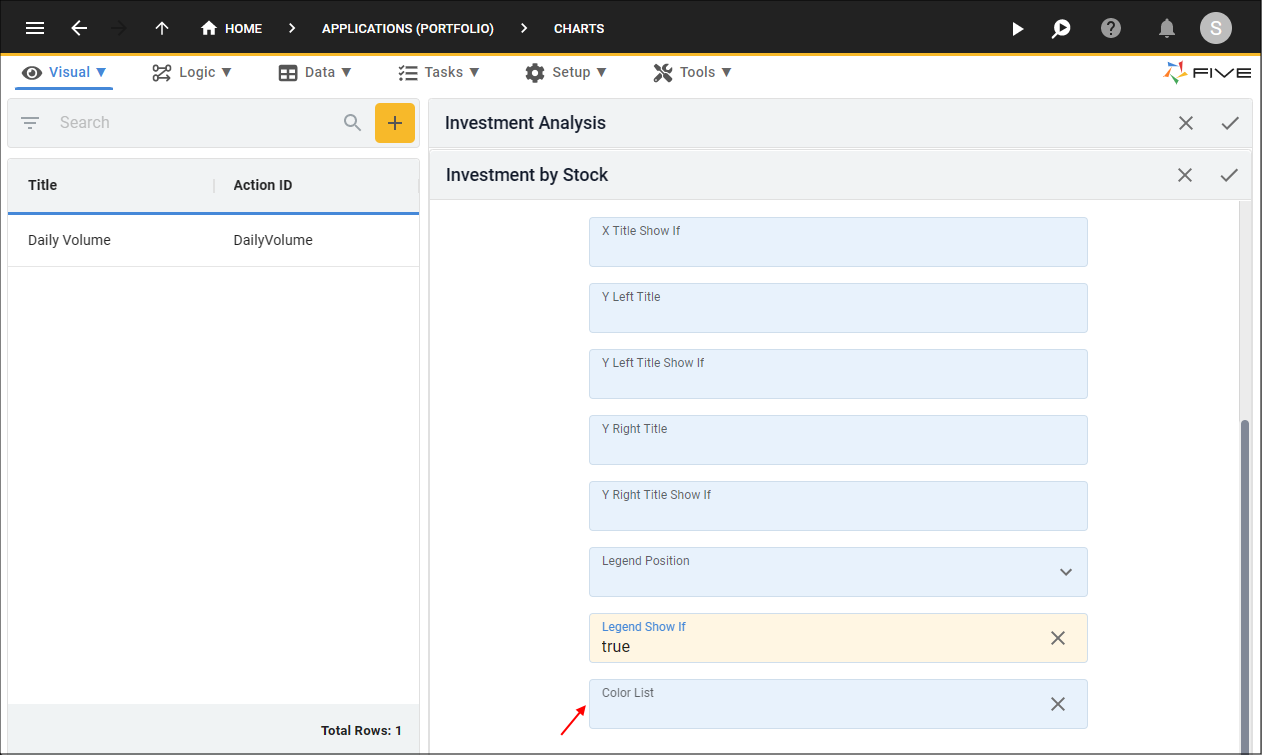
Figure 50 - Open the Color Picker
40. Click a color square.
41. Click the Add New Color button.
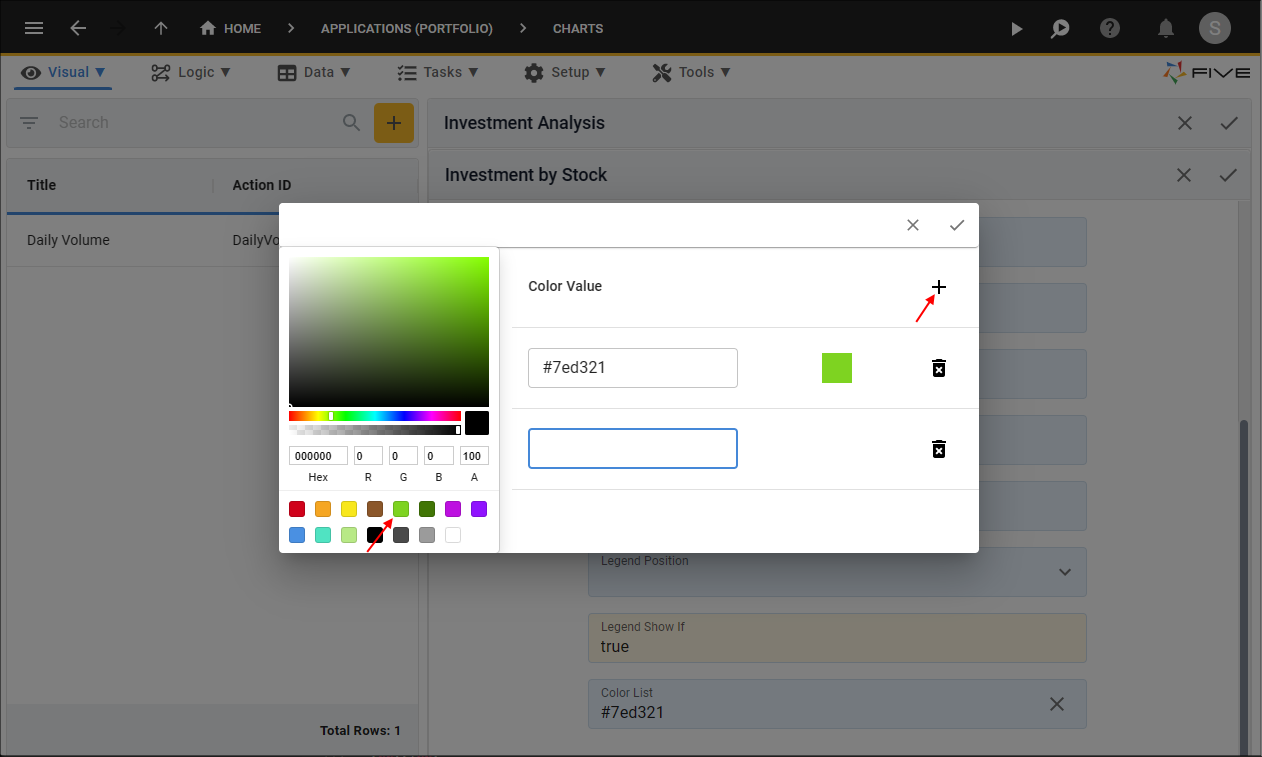
Figure 51 - Select colors
42. Repeat steps 10 and 11 to add three more colors.
43. Click the Save button in the Color Picker.
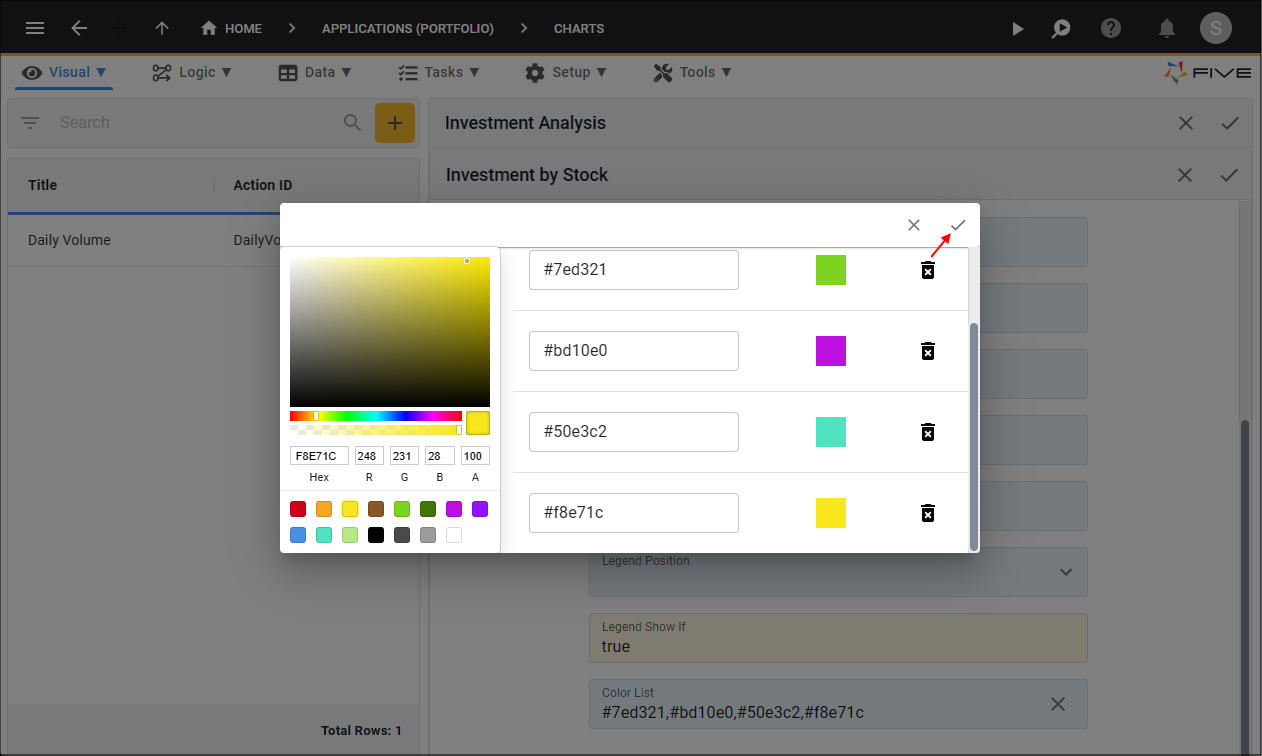
Figure 52 - Save colors
44. Click the Save button in the form app bar.
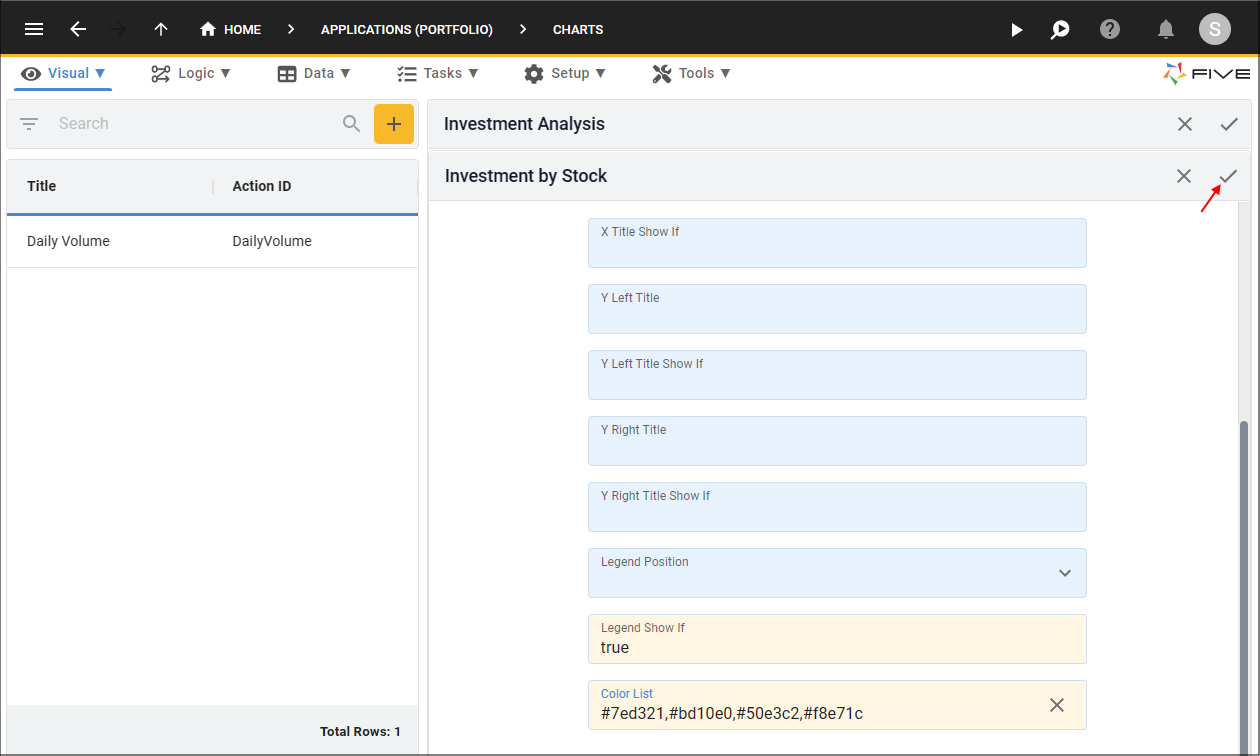
Figure 53 - Save Investment by Stock area
Add the Investment by Stock Dataset
45. Click the Datasets tab.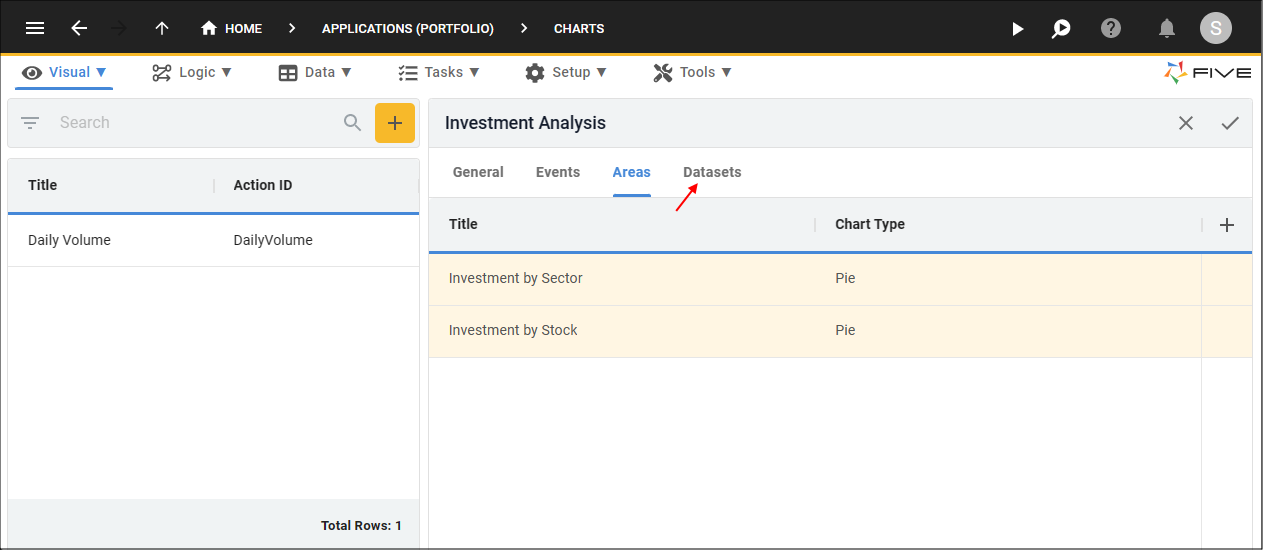
Figure 54 - Datasets tab
46. Click the Add Datasets button.
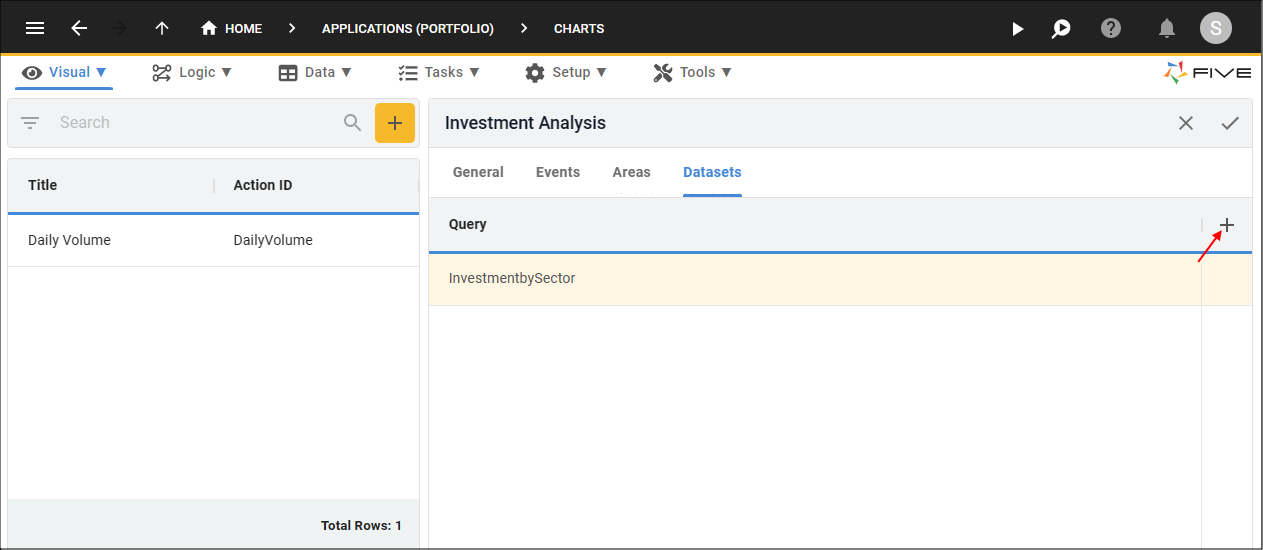
Figure 55 - Add Datasets button
47. Click the lookup icon in the query field and select InvestmentbyStock.
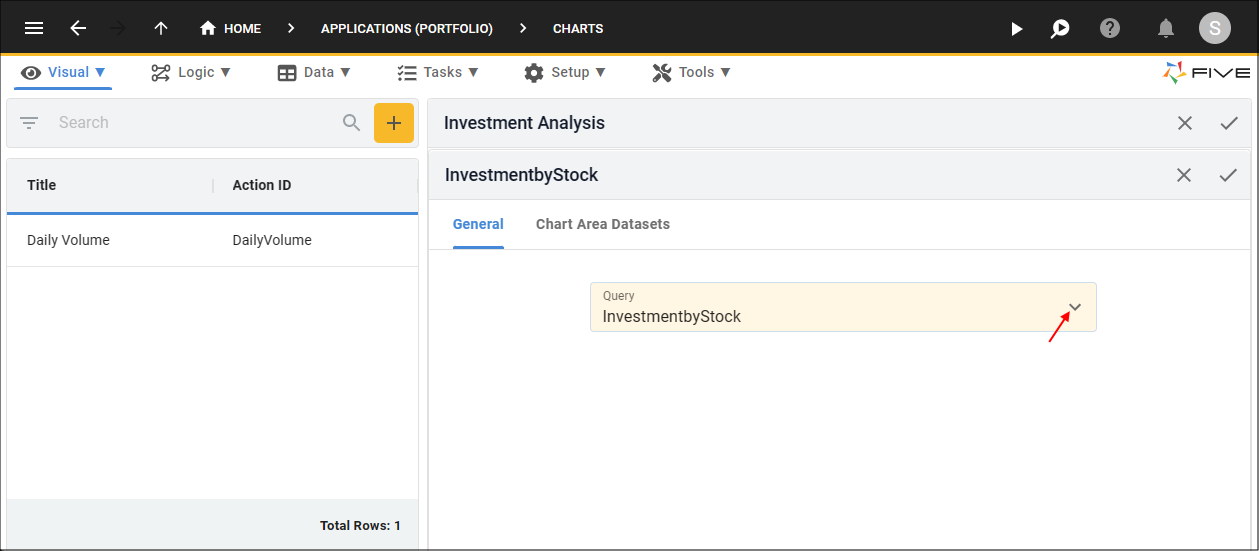
Figure 56 - Add the InvestmentbyStock dataset
48. Click the Chart Area Datasets tab.
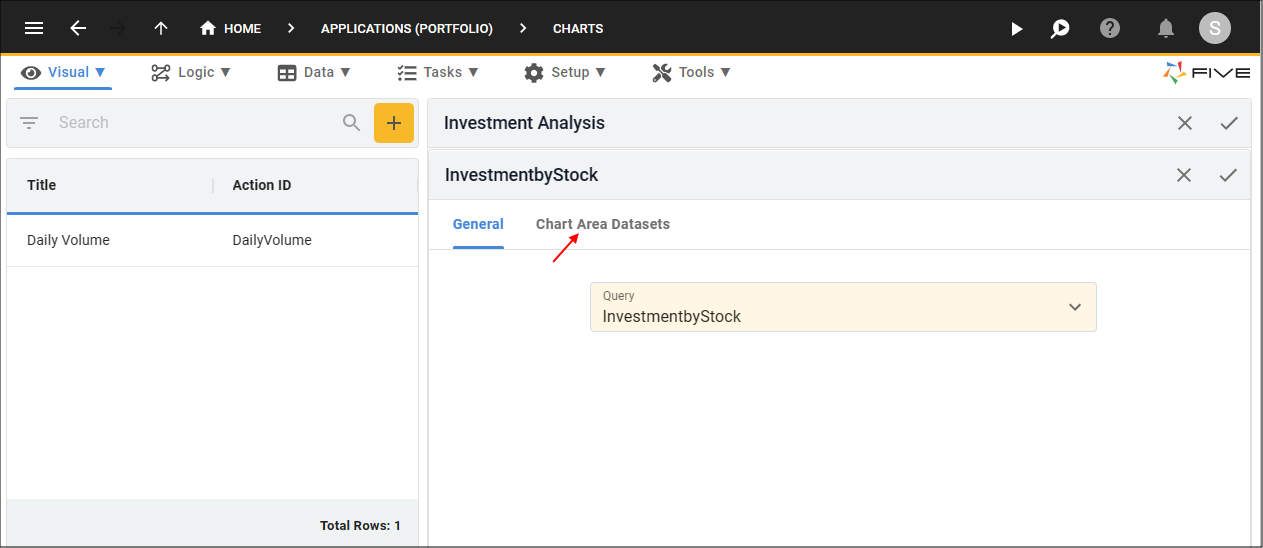
Figure 57 - Chart Area Datasets tab
49. Click the Add Chart Area Datasets button.
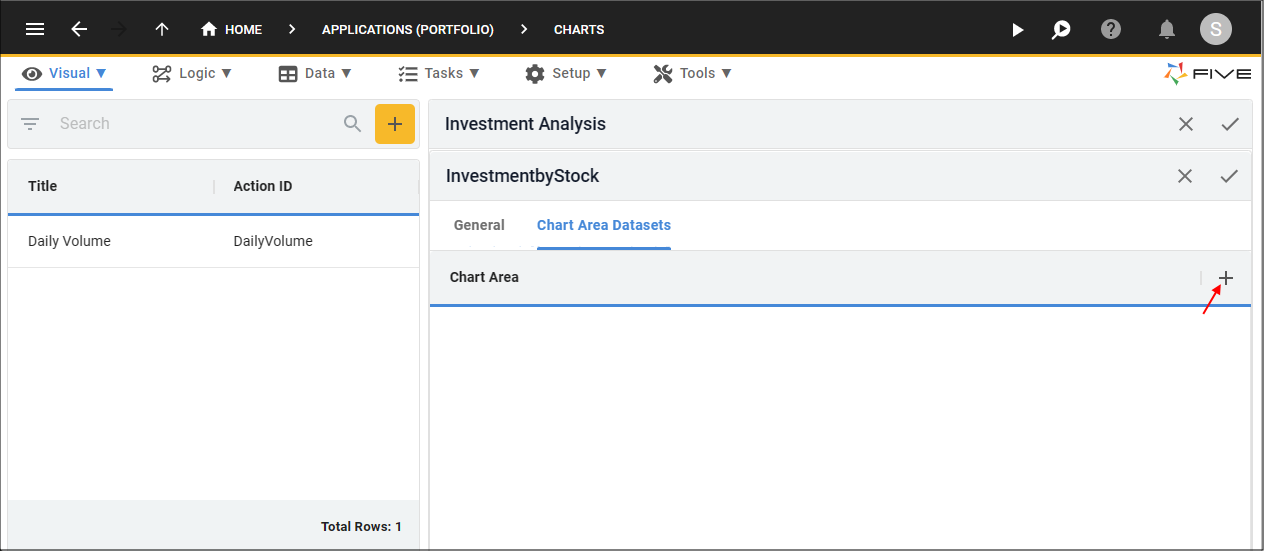
Figure 58 - Add Chart Area Datasets button
50. Click the lookup icon in the Chart Area field and select Investment by Stock.
51. Click the lookup icon in the X Value Column and select StockCode.
52. Click the lookup icon in the Y Value Column and select Investment.

Figure 59 - Add the Investment by Stock chart area dataset
53. Click the Save button in the form app bar,
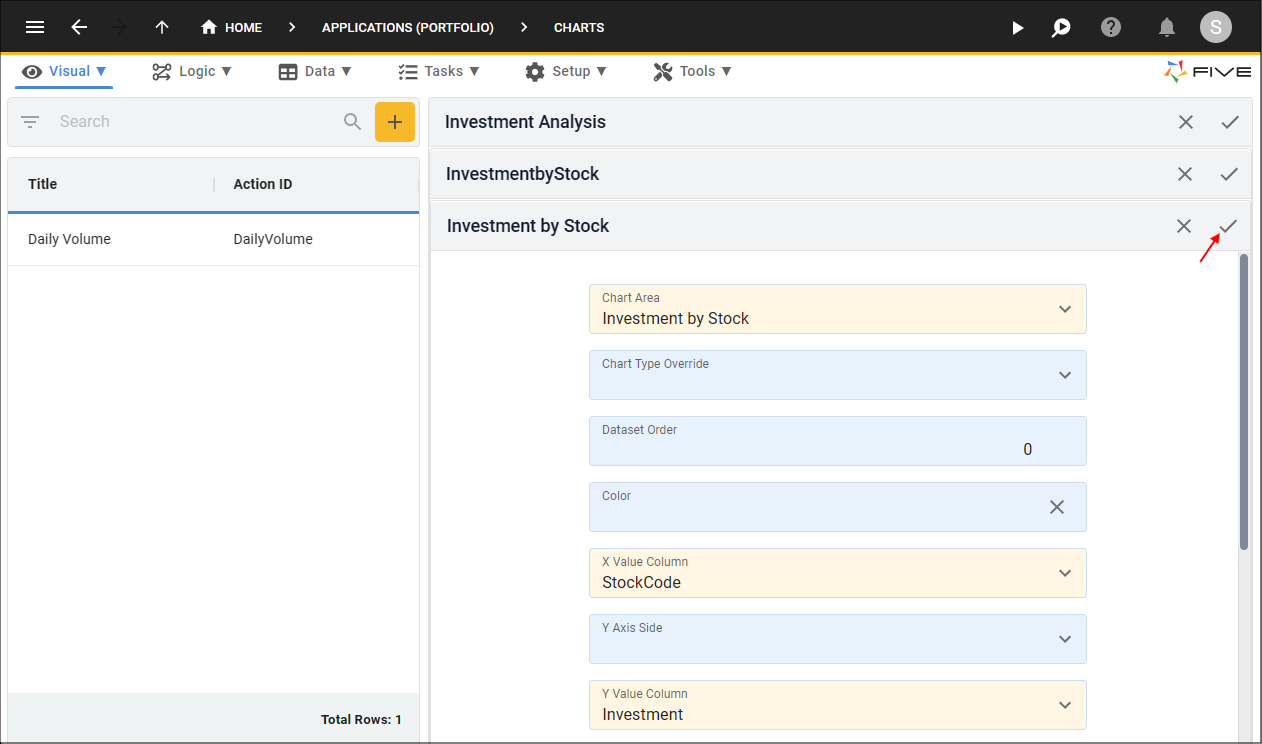
Figure 60 - Save the Investment by Stock chart area dataset
54. Click the Save button above the list.
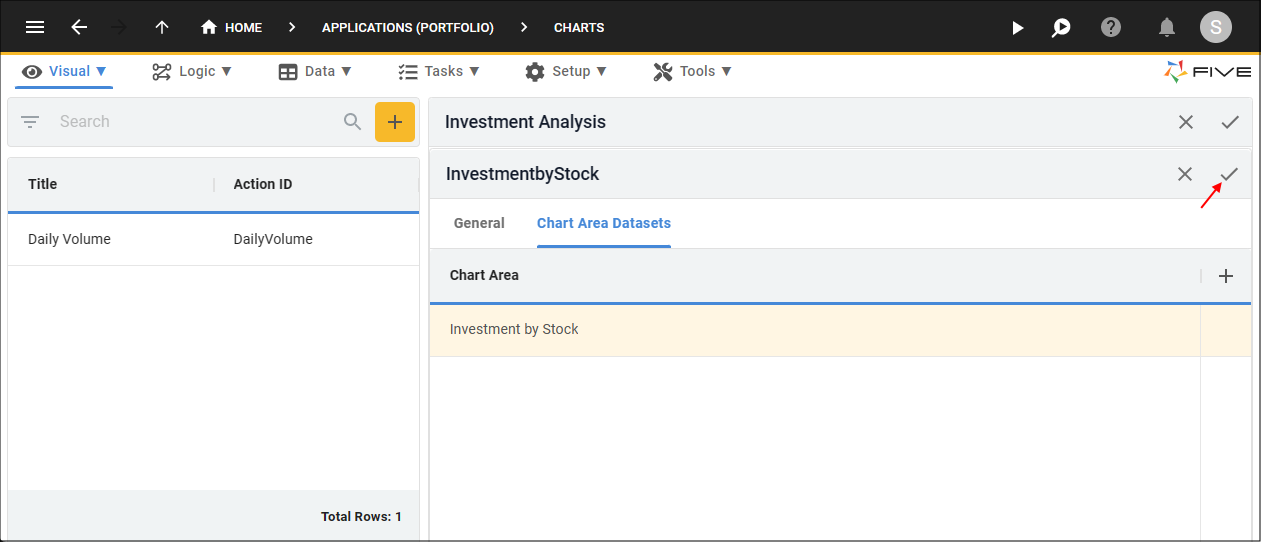
Figure 61 - Save the Investment by Stock chart area
55. Click the Save button above the list.
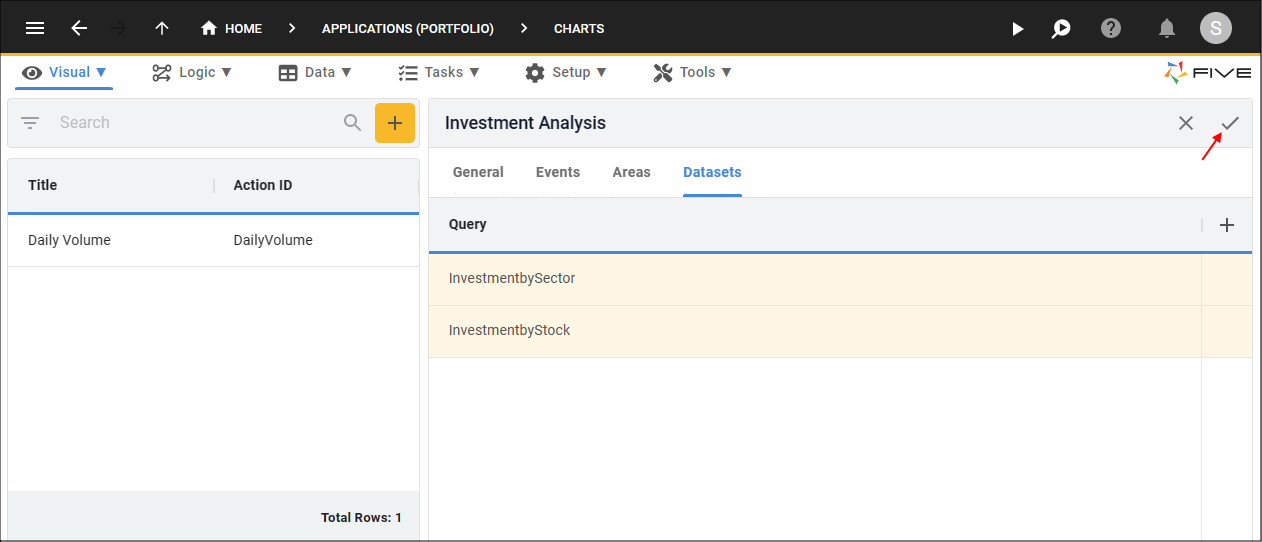
Figure 62 - Save the Investment Analysis chart
Create a Menu Item
info
In order to view our chart we need to add a menu item for it.
1. Click Visual in the menu.
2. Click Menus in the sub-menu.
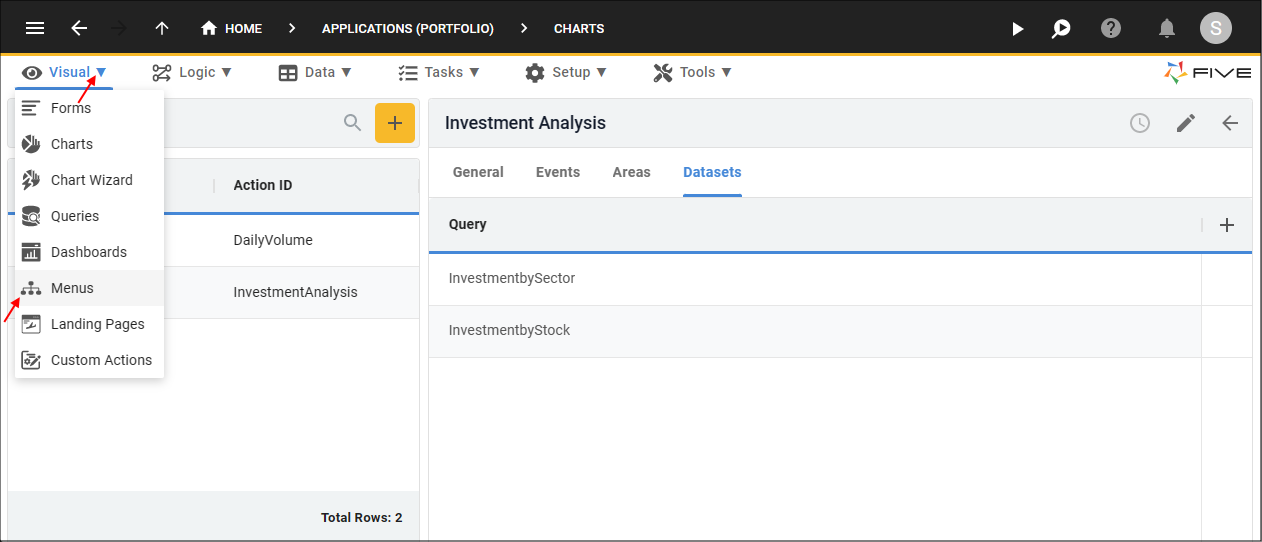
Figure 63 - Menus menu item
3. Click the Add Item button.
4. Type Portfolio Analysis in the Caption field.
5. Type 1 in the Menu Order field.
6. Click the lookup icon in the Action field and select InvestmentAnalysis (Chart)
7. Click the lookup icon in the Parent Menu field and select Portfolios (Portfolios)
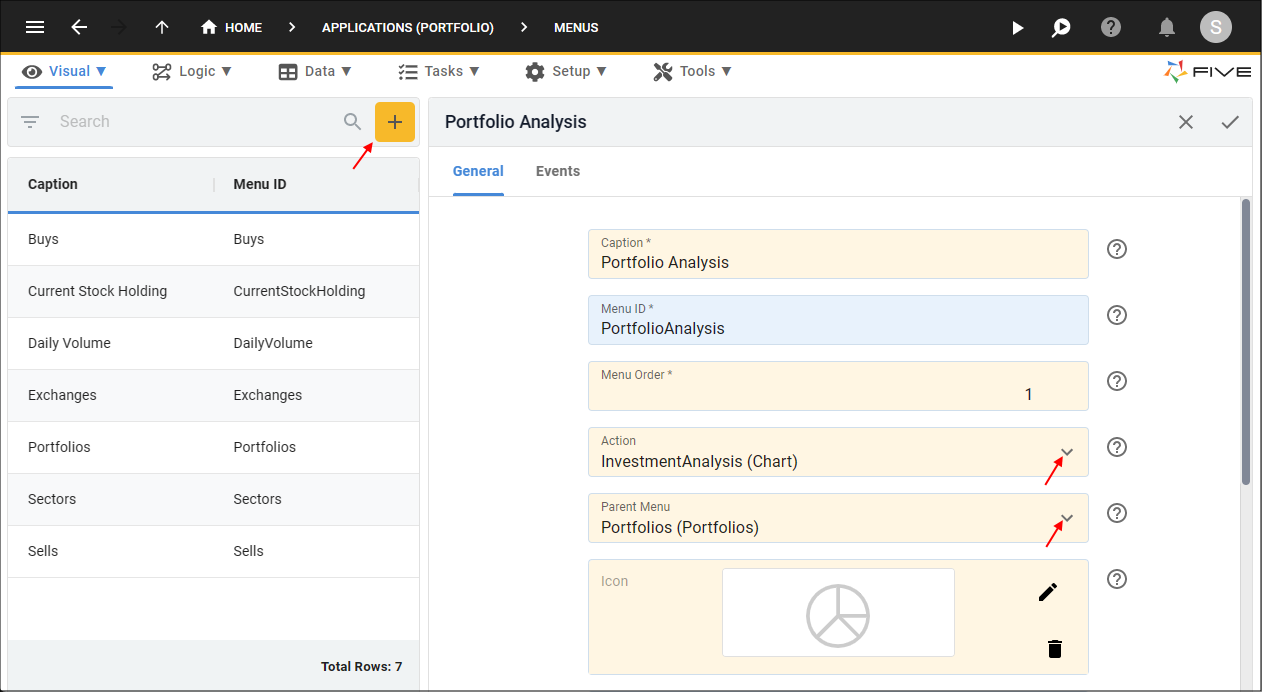
Figure 64 - Add the Portfolio Analysis menu
8. Click the Save button in the form app bar.
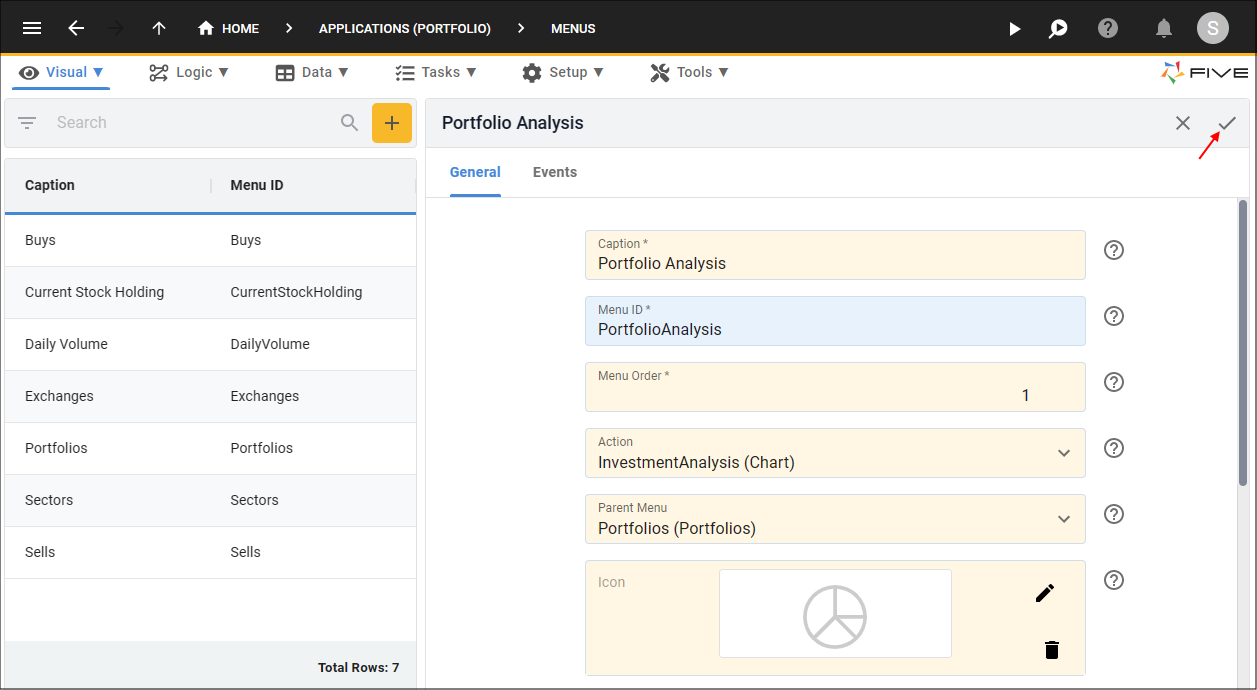
Figure 65 - Save the Portfolio Analysis menu
Run the Portfolio Application
1. Click the Run button in Five's toolbar.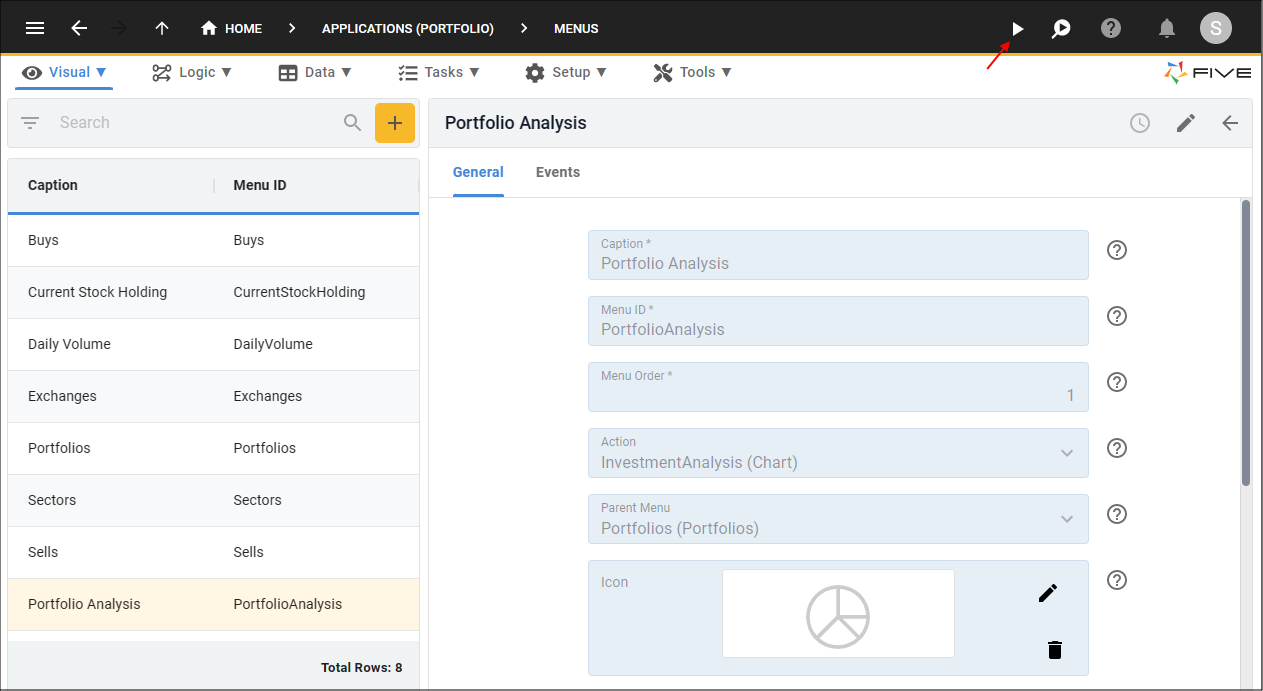
Figure 66 - Run button
2. Select the Growth Portfolio record.
3. Click the Down button in the form app bar.
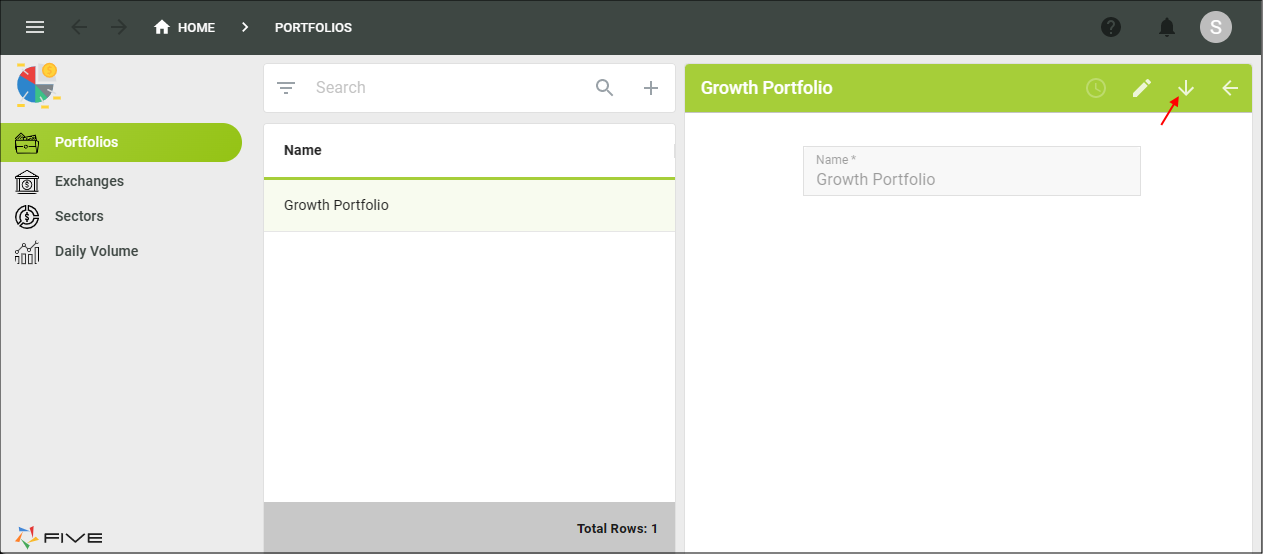
Figure 67 - Down button
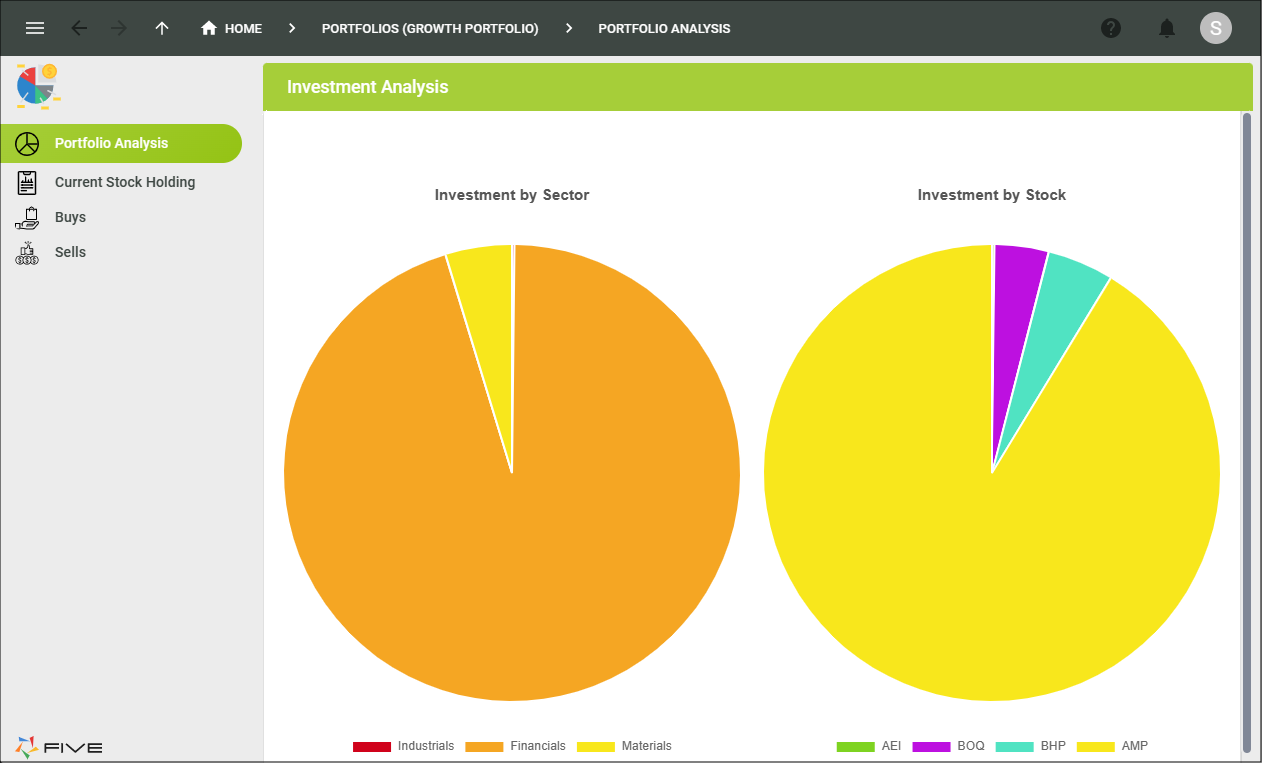
Figure 68 - Portfolio analysis charts