8 - Create Charts
Last updated 26/03/2023
There are two ways to create charts in Five, you can use:- Five's Chart Wizard; or
- The Chart Form
- A query must be written in the Queries view to determine the result set.
- The query must be attached to the chart in the Chart Wizard or on the Charts Form.
info
The Daily Volume query that you just defined will be used here for the chart result set.
Navigate to the Chart Wizard
1. Select Visual in the menu.2. Select Chart Wizard in the sub-menu.
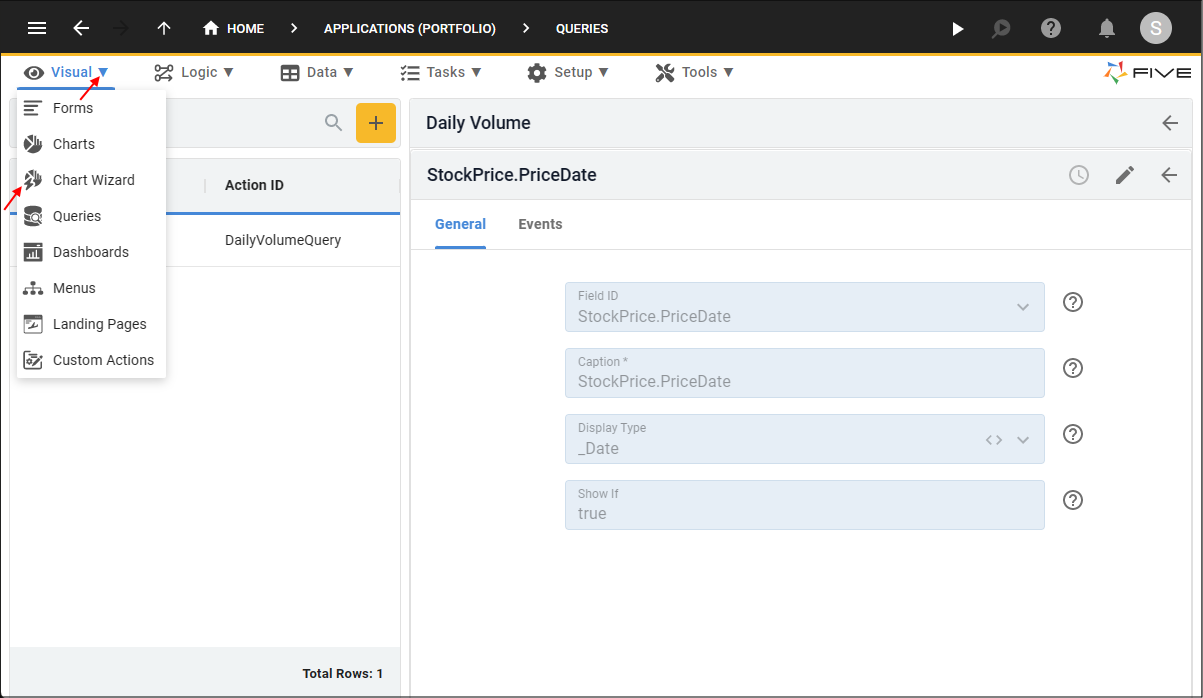
Figure 1 - Chart Wizard menu item
Add the Daily Volume Chart
1. Type Daily Volume in the Chart Title field.2. Click the lookup icon in the Query field and select DailyVolumeQuery.
3. Click the lookup icon in the X Value Column field and select StockPrice.PriceDate.
4. Click the lookup icon in the Y Value Column field and select StockPrice.Volume.
caution
Five will strip any conditions and WHERE clauses while in the Chart Wizard, however, these will be set in your end-user application.
5. Type January 2020 in the Chart Area Title field.
6. Click the Show Chart Area Title switch.
7. Click the lookup icon in the Chart Type field and select Line.
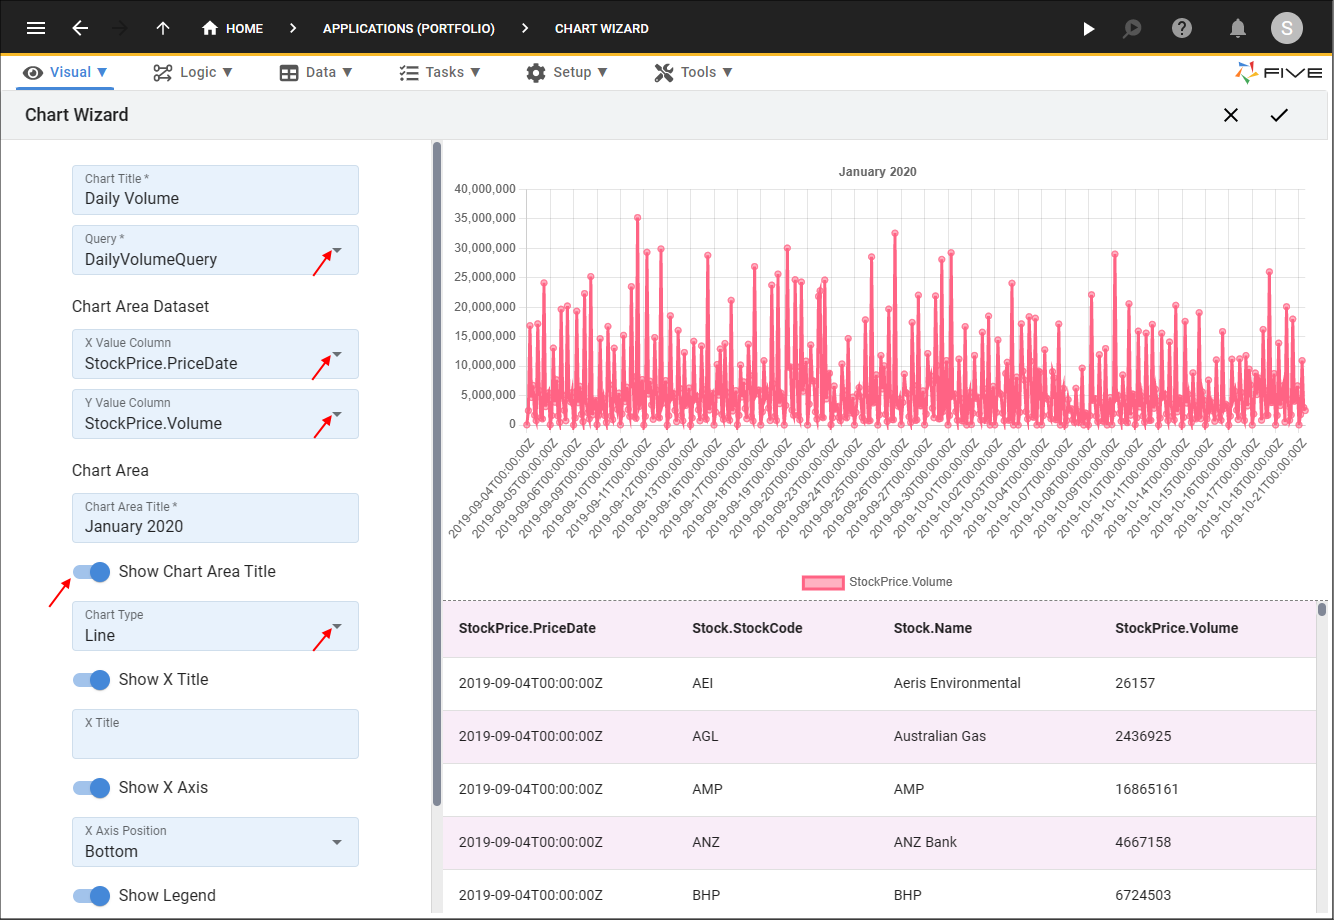
Figure 2 - Add the Daily Volume chart
8. Click in the Color Picker field.
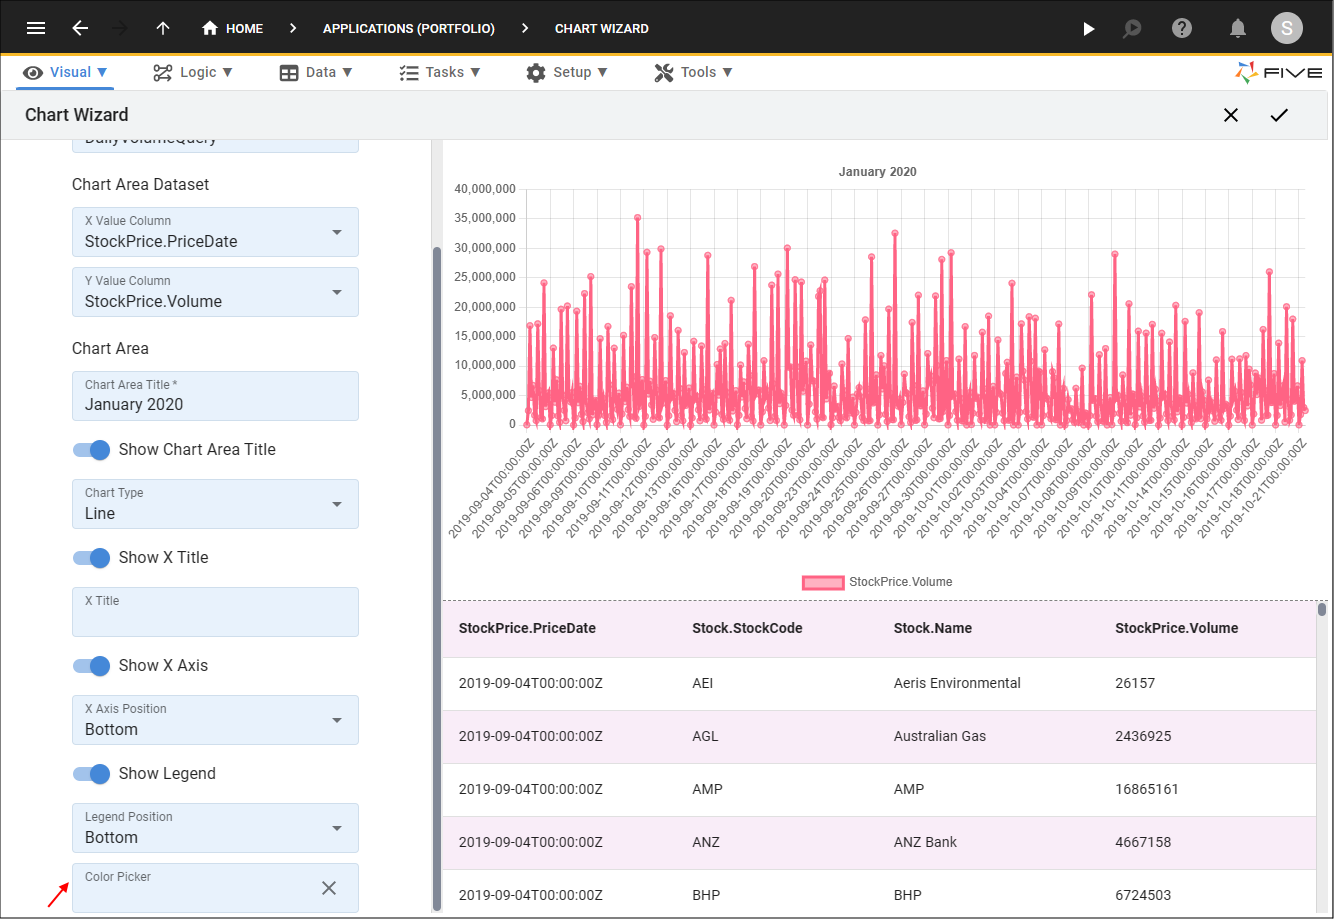
Figure 3 - Color Picker field
9. Select a color.
10. Click the Save button in the Color Picker app bar.
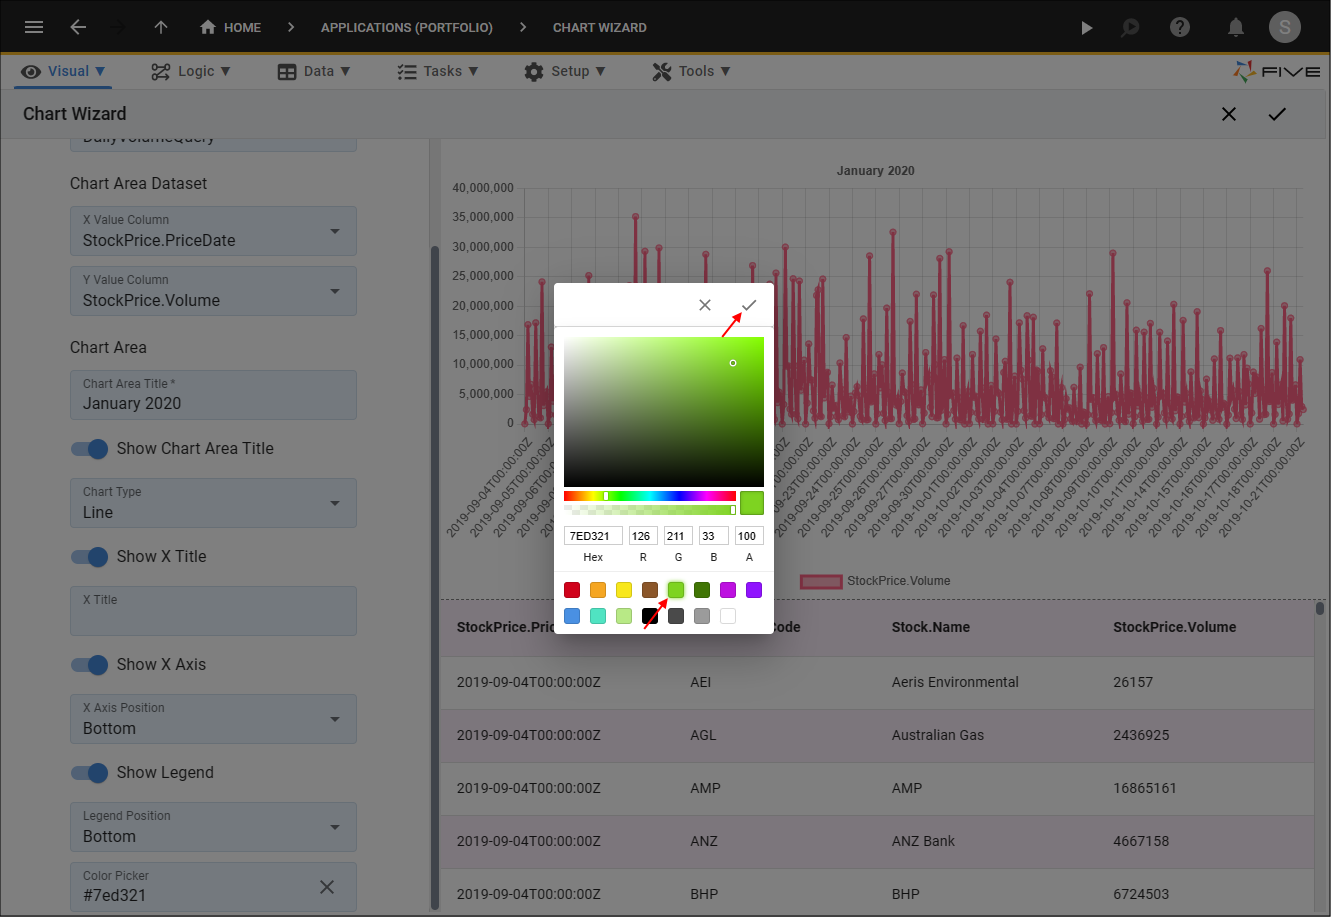
Figure 4 - Select and save a color
11. Click the Save button in the Chart Wizard app bar.
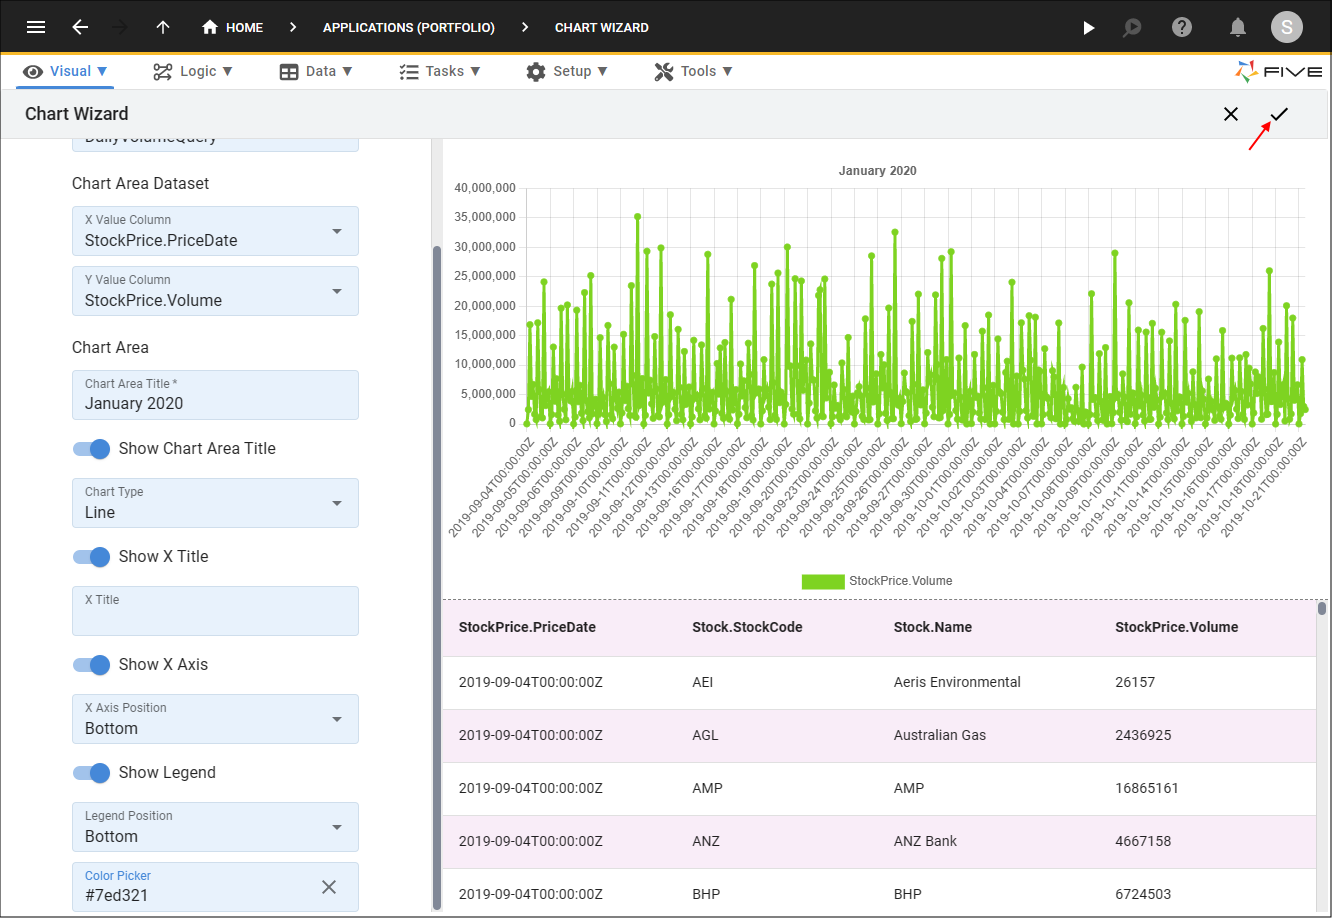
Figure 5 - Save the Daily Volume chart