10 - Create Charts with Multiple Datasets
Last updated 21/12/2023
This documentation is to demonstrate how to create charts with multiple datasets. These datasets can be plotted on the same chart area or used in different chart areas that are displayed on the one page. As you would remember from the Quick Start Guide, you create a chart from a data source, for this example we will be using queries as our data sources.We are going to add two chart areas on the one chart view, one will display our investment by sector and the other our investment by stock.
The quickest way to add a chart is with Five's Chart Wizard, however, you cannot add multiple datasets using the wizard. We will add the first chart using the Chart Wizard and then edit the record to add another dataset.
tip
You can also create both charts using the Chart Wizard and then create a dashboard to display both charts in the one view!
Navigate to Queries
1. Click Data in the menu.2. Click Queries in the sub-menu.
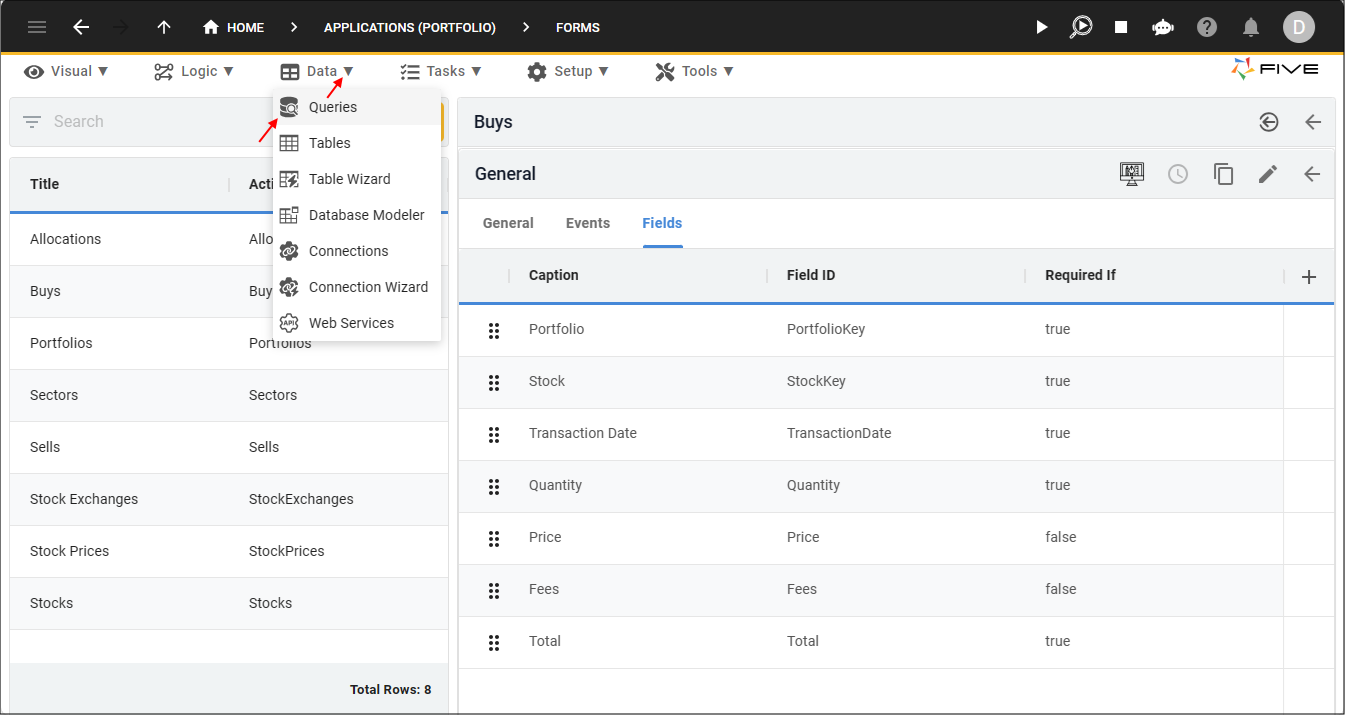
Figure 1 - Queries menu item
Add the InvestmentBySector Query
1. Click the Add Item button.2. Type InvestmentBySector in the Data Source ID field.
3. Click in the Query field to open Five's Query Builder.
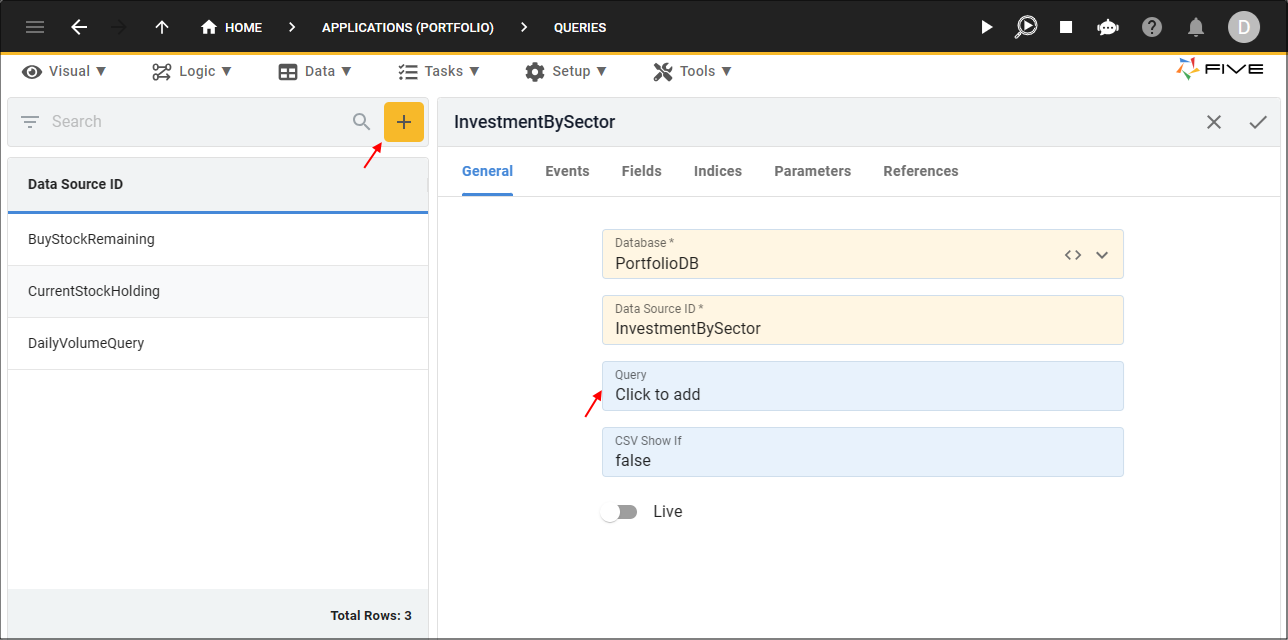
Figure 2 - Add the InvestmentBySector query
4. Click the SQL tab.
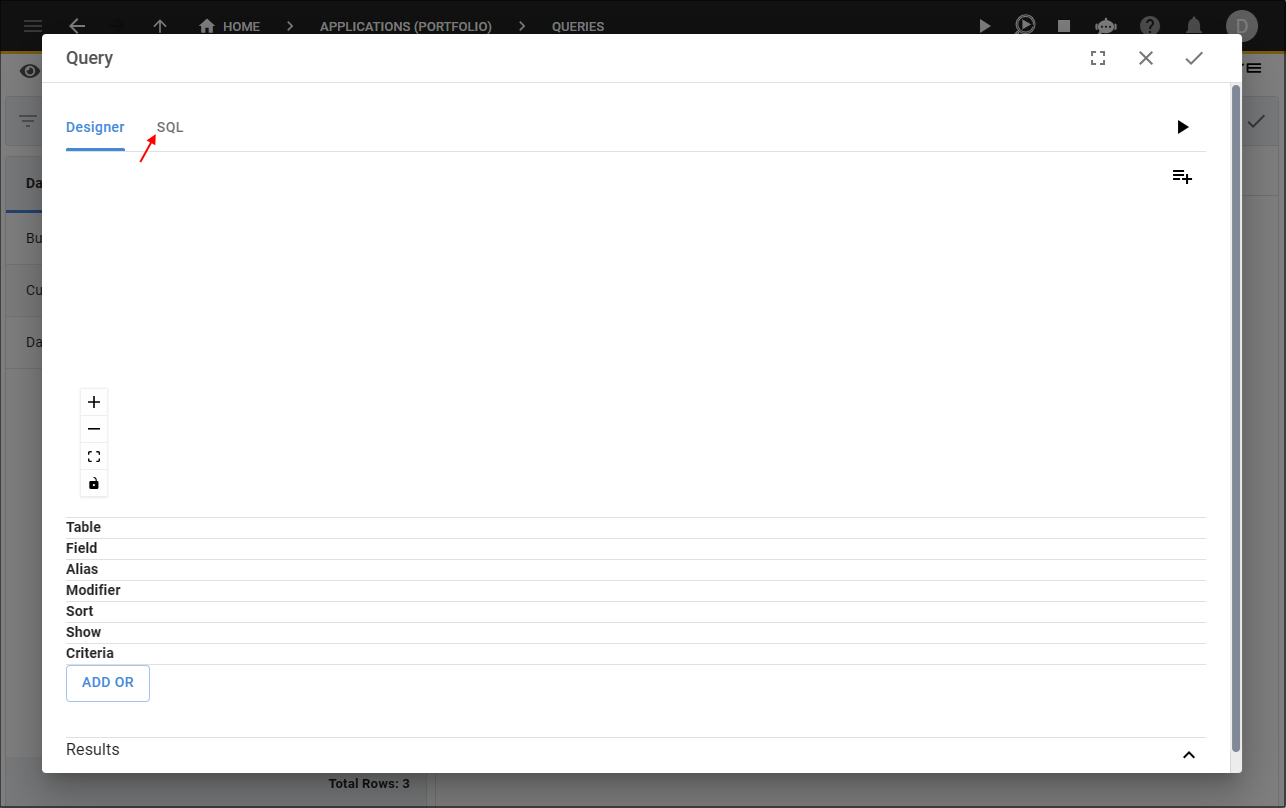
Figure 3 - SQL tab
5. Click the Copy button for the below syntax.

InvestmentBySector
SELECT
    Sector,
    StockCode,
    SUM(Bought - Sold) AS Holding,
    SUM(OriginalCost * (Bought - Sold) / Bought) AS Investment
FROM (
    SELECT
        Sector.Name AS Sector,
        Stock.StockCode AS StockCode,
           Buy.PortfolioKey,
        Buy.Quantity AS Bought,
        IFNULL((SELECT SUM(Allocation.Quantity) FROM Allocation WHERE Allocation.BuyKey = Buy.BuyKey),0) AS Sold,
        Buy.Total AS OriginalCost
    FROM
        Buy
        INNER JOIN Stock ON Buy.StockKey = Stock.StockKey
        INNER JOIN Sector ON Stock.SectorKey = Sector.SectorKey
 HAVING
        (Buy.PortfolioKey = ?) AND
        (Bought > Sold)
    ) AS Summary
GROUP BY
    Sector
6. Paste the syntax in the SQL Editor.
7. Click the Save button in the SQL Editor app bar.
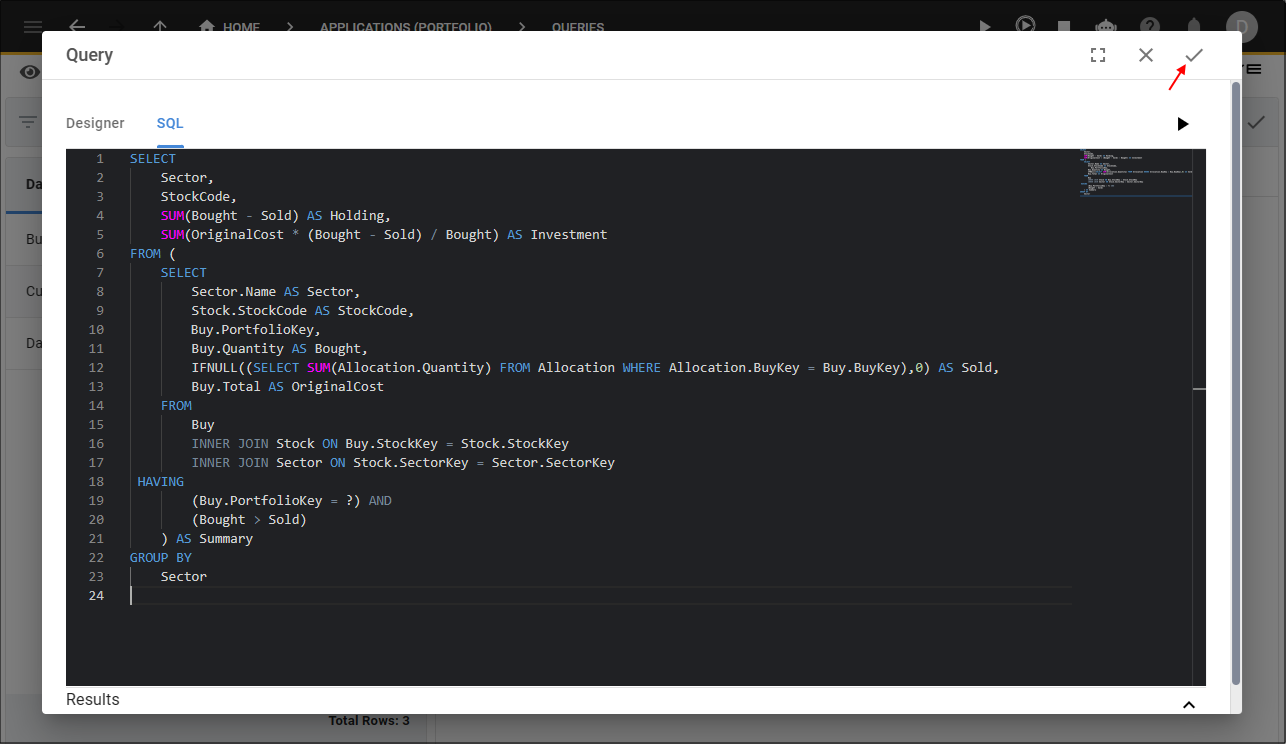
Figure 4 - Save button
8. Click the Fields tab.
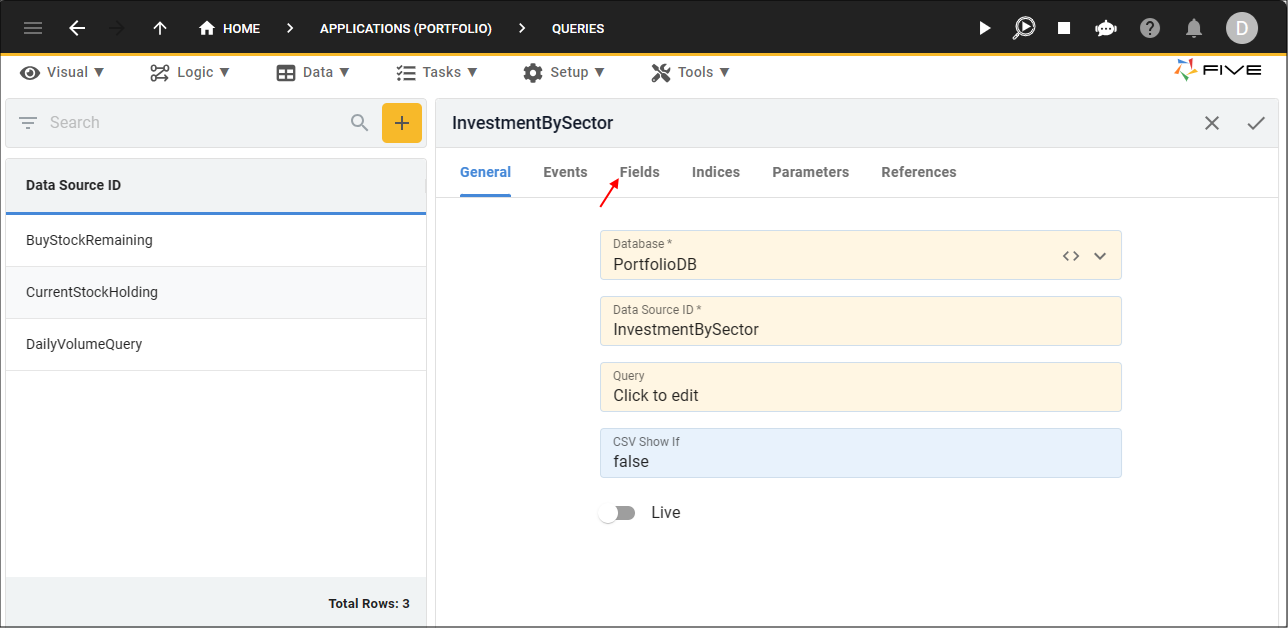
Figure 5 - Fields tab
9. Select the Holding record.
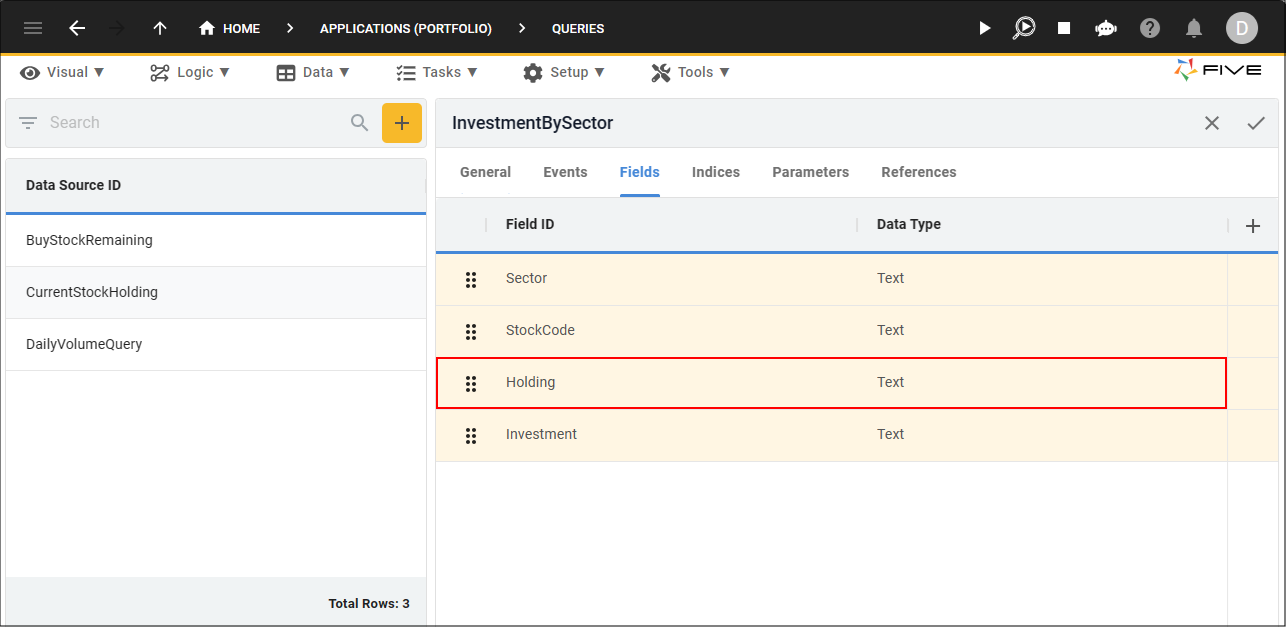
Figure 6 - Holding record
10. Either click the Edit button in the form app bar, or click directly in the Data Type field.
11. Click the lookup icon in the Data Type field and select Integer.
12. Type 4 in the Size field.
13. Click the lookup icon in the Default Display Type field and select _Integer.
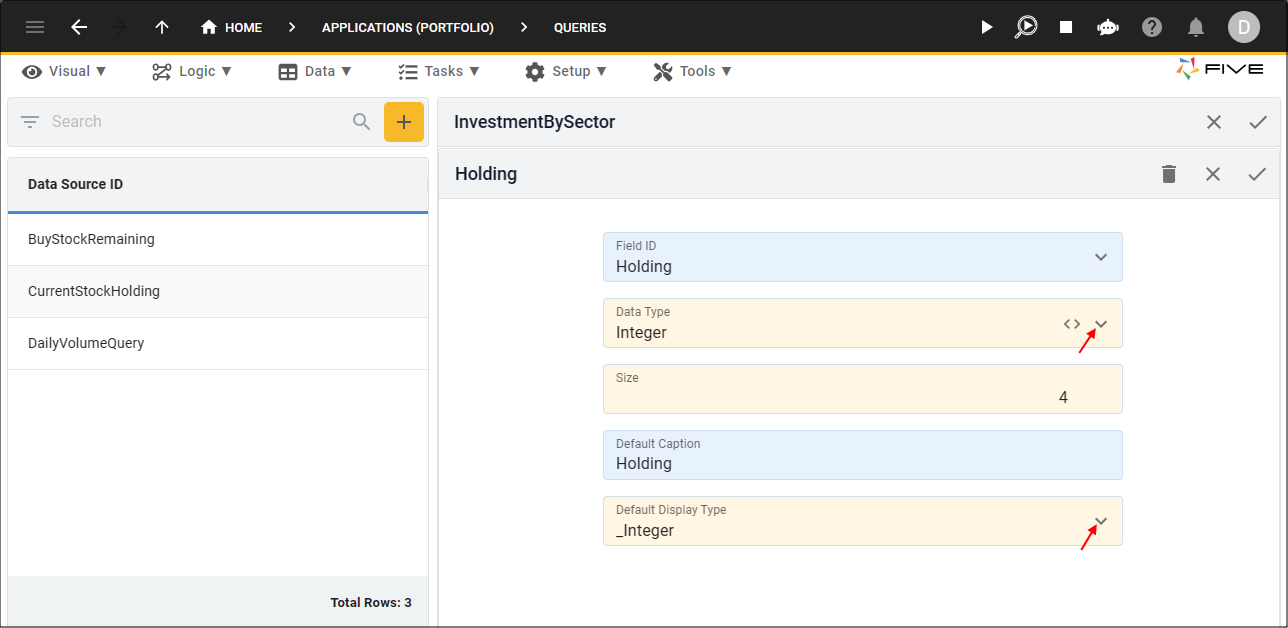
Figure 7 - Edit the Holding field
14. Click the Save button in the form app bar.
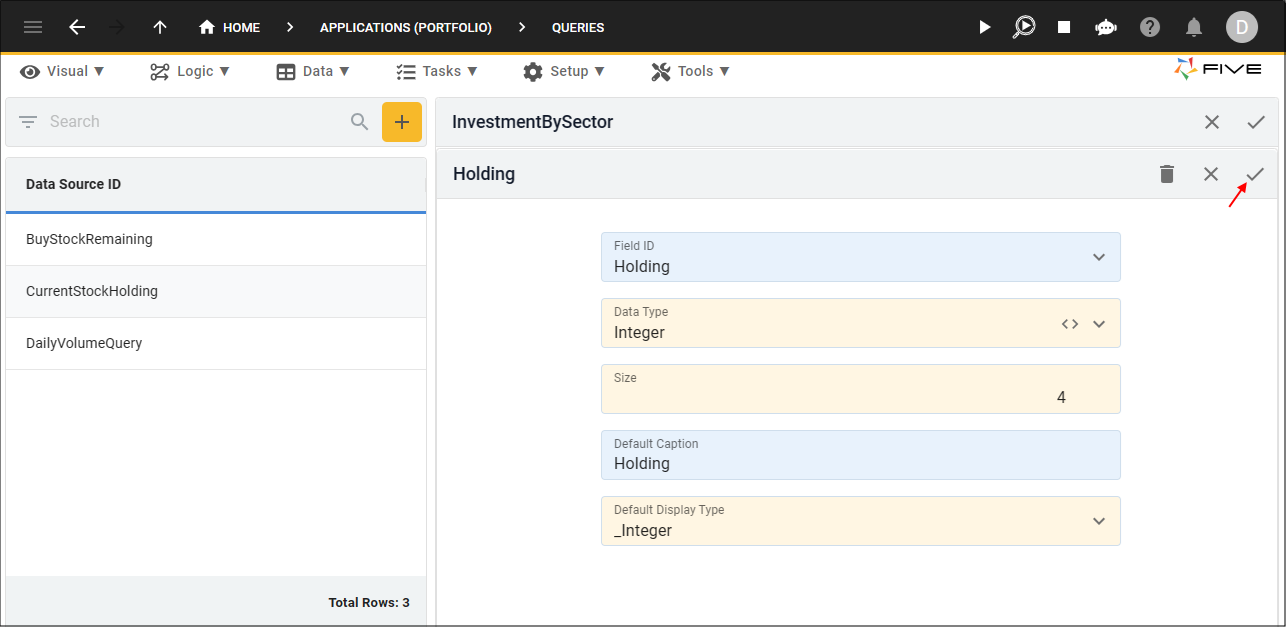
Figure 8 - Save button
15. Select the Investment record.
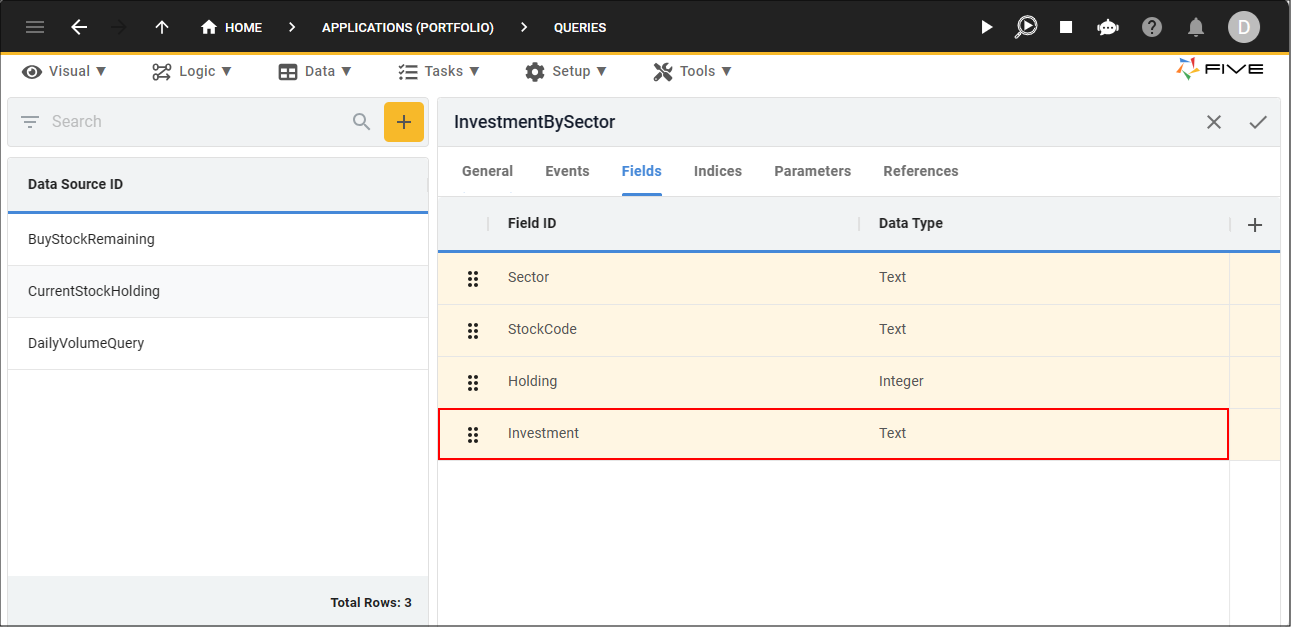
Figure 9 - Investment record
16. Either click the Edit button in the form app bar, or click directly in the Data Type field.
17. Click the lookup icon in the Data Type field and select Float.
18. Type 8 in the Size field.
19. Click the lookup icon in the Default Display Type field and select _Currency.
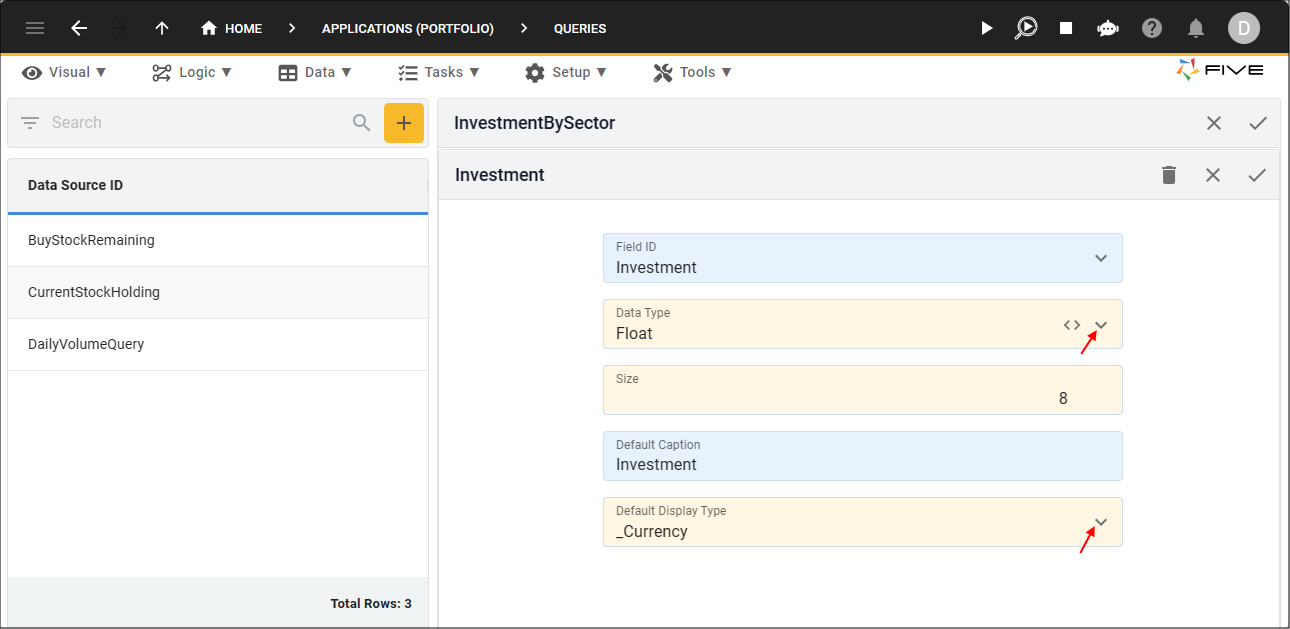
Figure 10 - Edit the Investment field
20. Click the Save button in the form app bar.
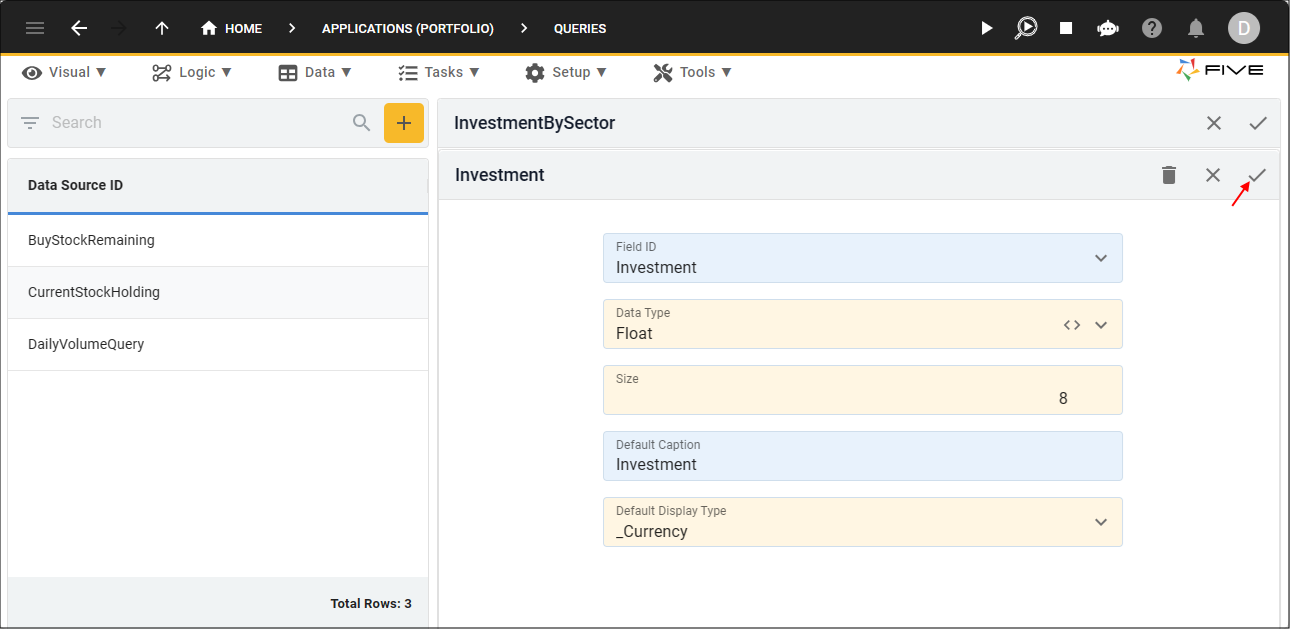
Figure 11 - Save button
21. Click the Parameters tab.
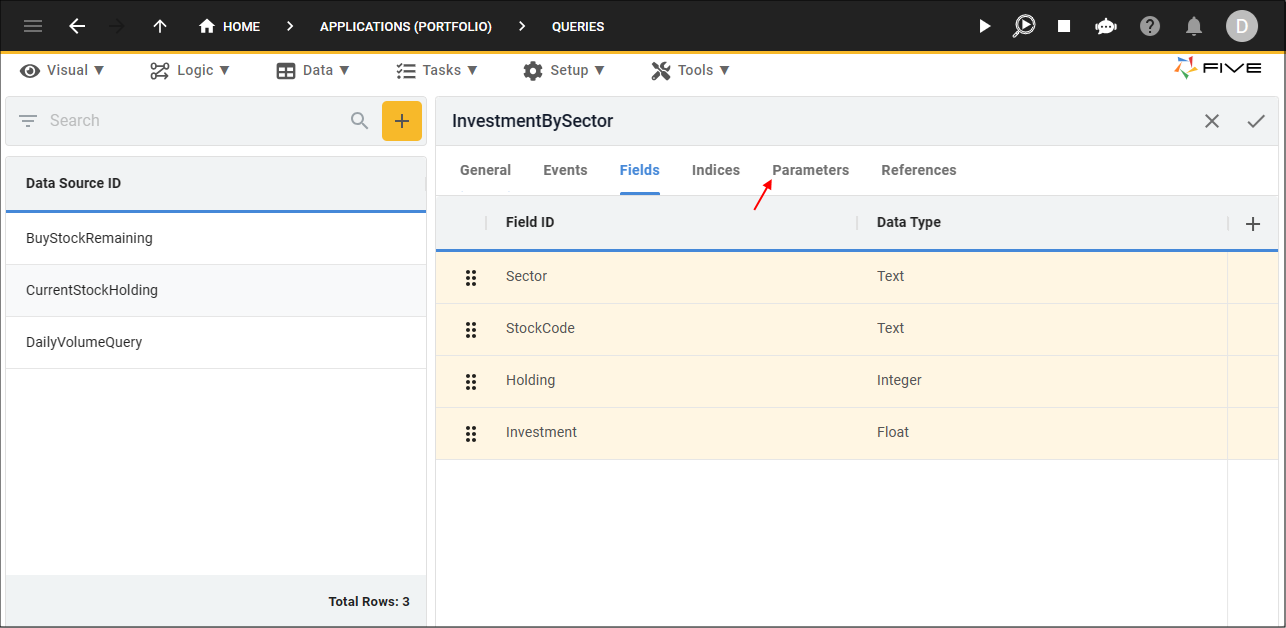
Figure 12 - Parameters tab
22. Click the Add Parameters button.
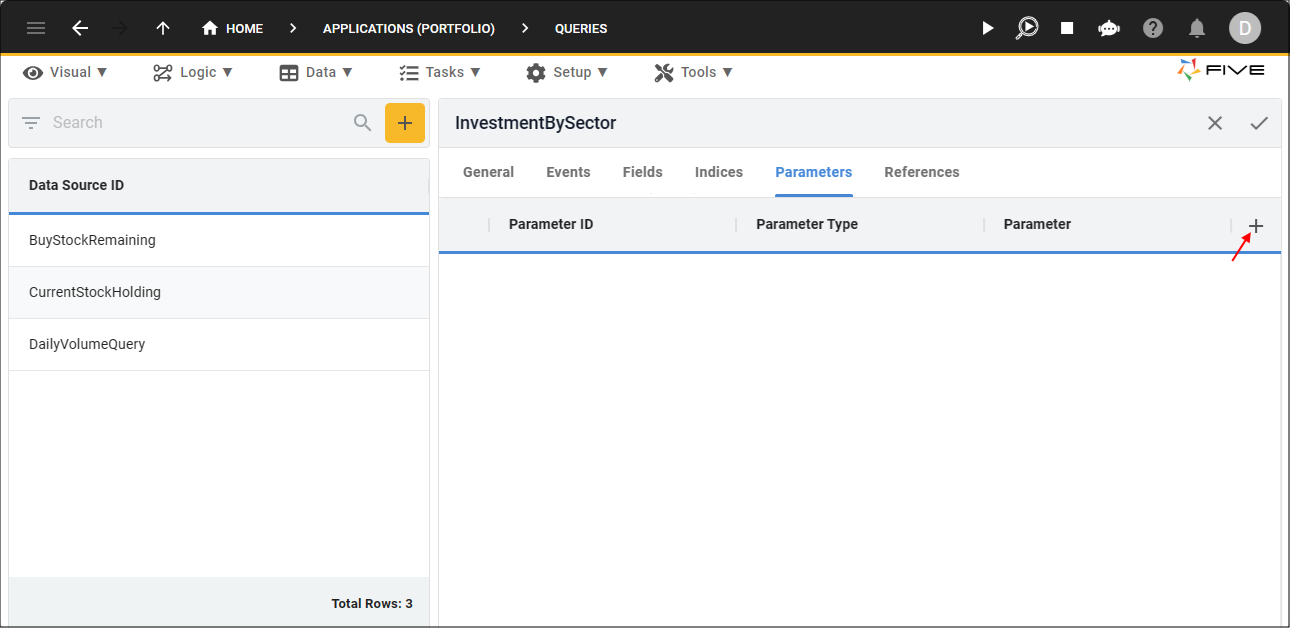
Figure 13 - Add Parameters button
23. Type PortfolioKey in the Parameter ID field.
24. Type
{{five.stack.Portfolio.PortfolioKey}}
in the Parameter field.
25. Click the Save button in the form app bar.
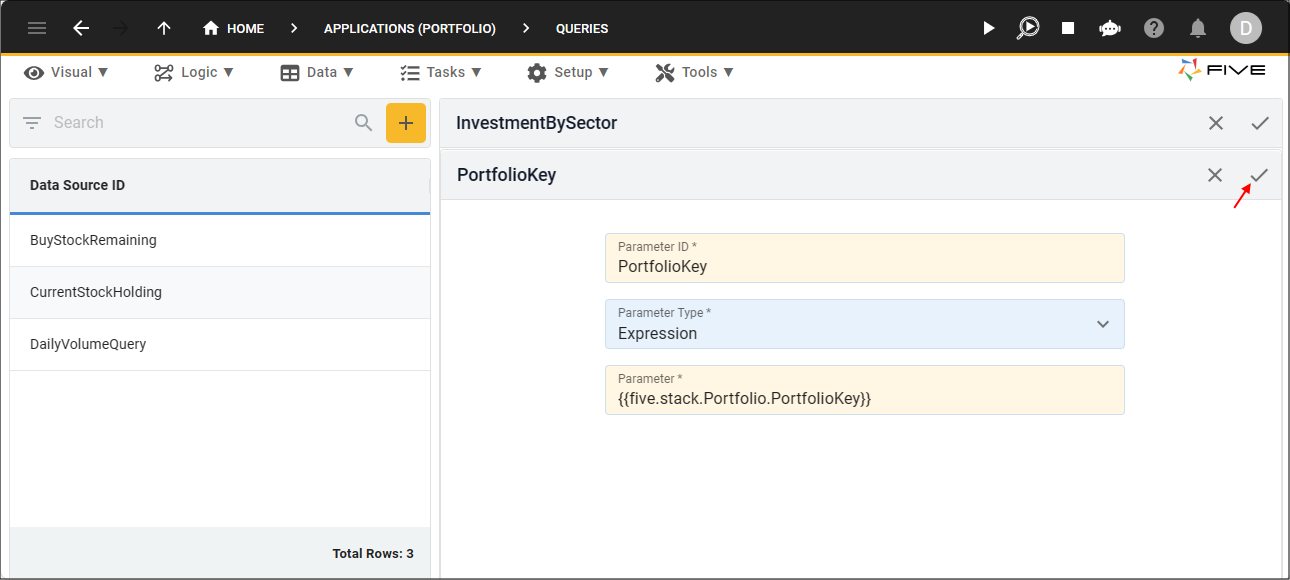
Figure 14 - Add the PortfolioKey parameter
26. Click the Save button in the form app bar above the list.
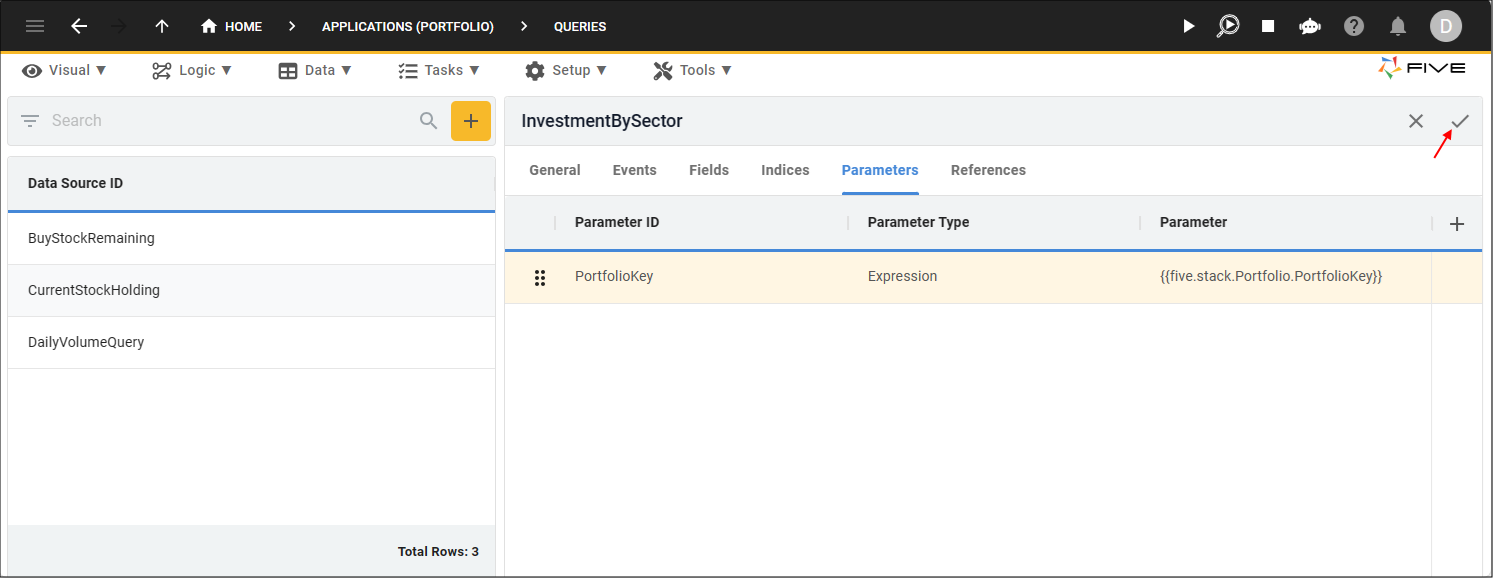
Figure 15 - Save button
Add the InvestmentByStock Query
info
The InvestmentByStock query has the same query fields and parameter as the InvestmentBySector query. The only difference between the
two queries is one line of code in the SQL syntax. We will use the Copy button again here, as it will copy the InvestmentBySector record including the SQL syntax, the query fields, and the
parameter.
1. Click the Copy button.
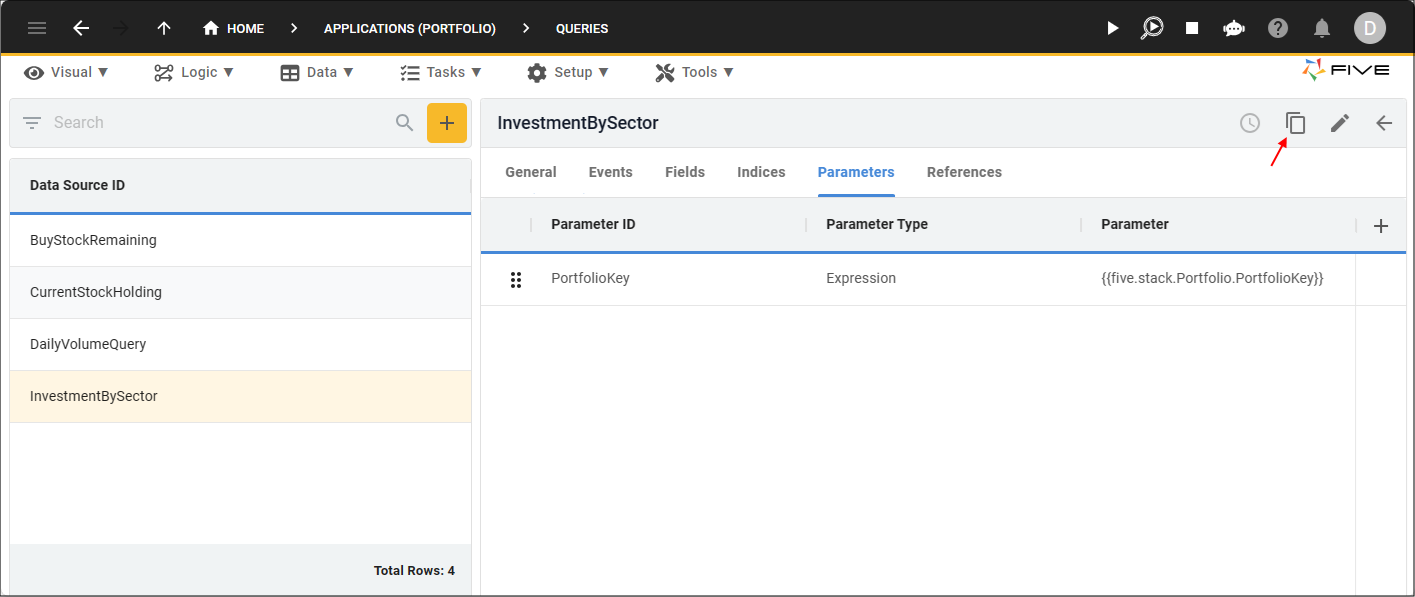
Figure 16 - Copy button
2. Delete Sector in the Data Source ID field and type Stock.
note
The value in your Data Source ID field should be: InvestmentByStock.
3. Click in the Query field to open Five's Query Builder.
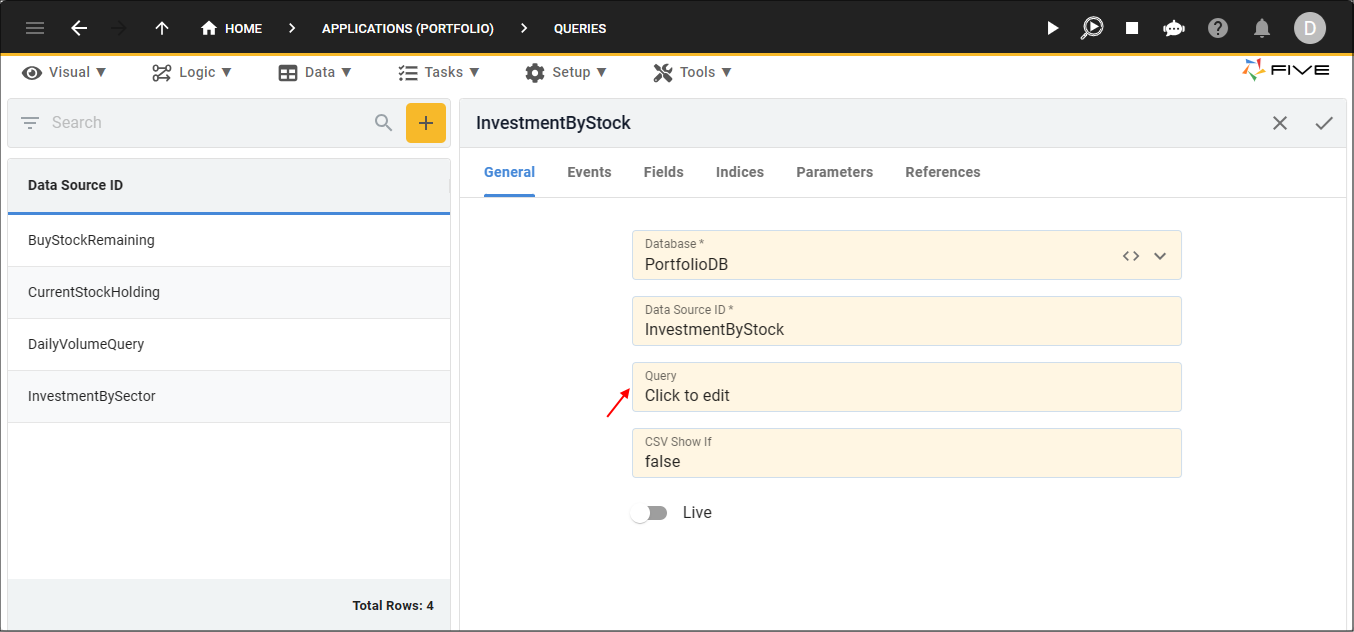
Figure 17 - Add the InvestmentByStock query
4. Edit the
GROUP BY
statement by adding , StockCode
.
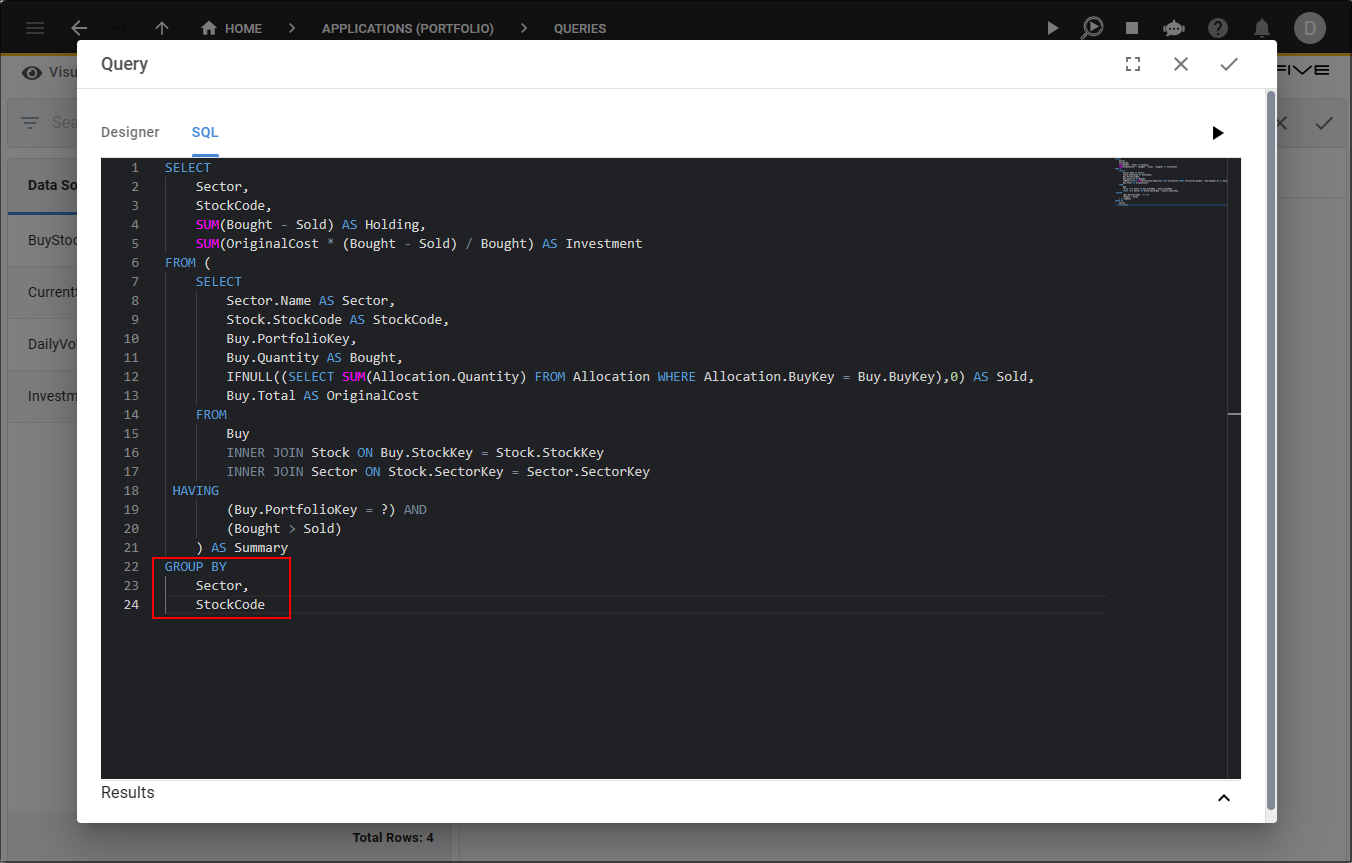
Figure 18 - Edit the GROUP BY statement
5. Click the Save button in the SQL Editor app bar.
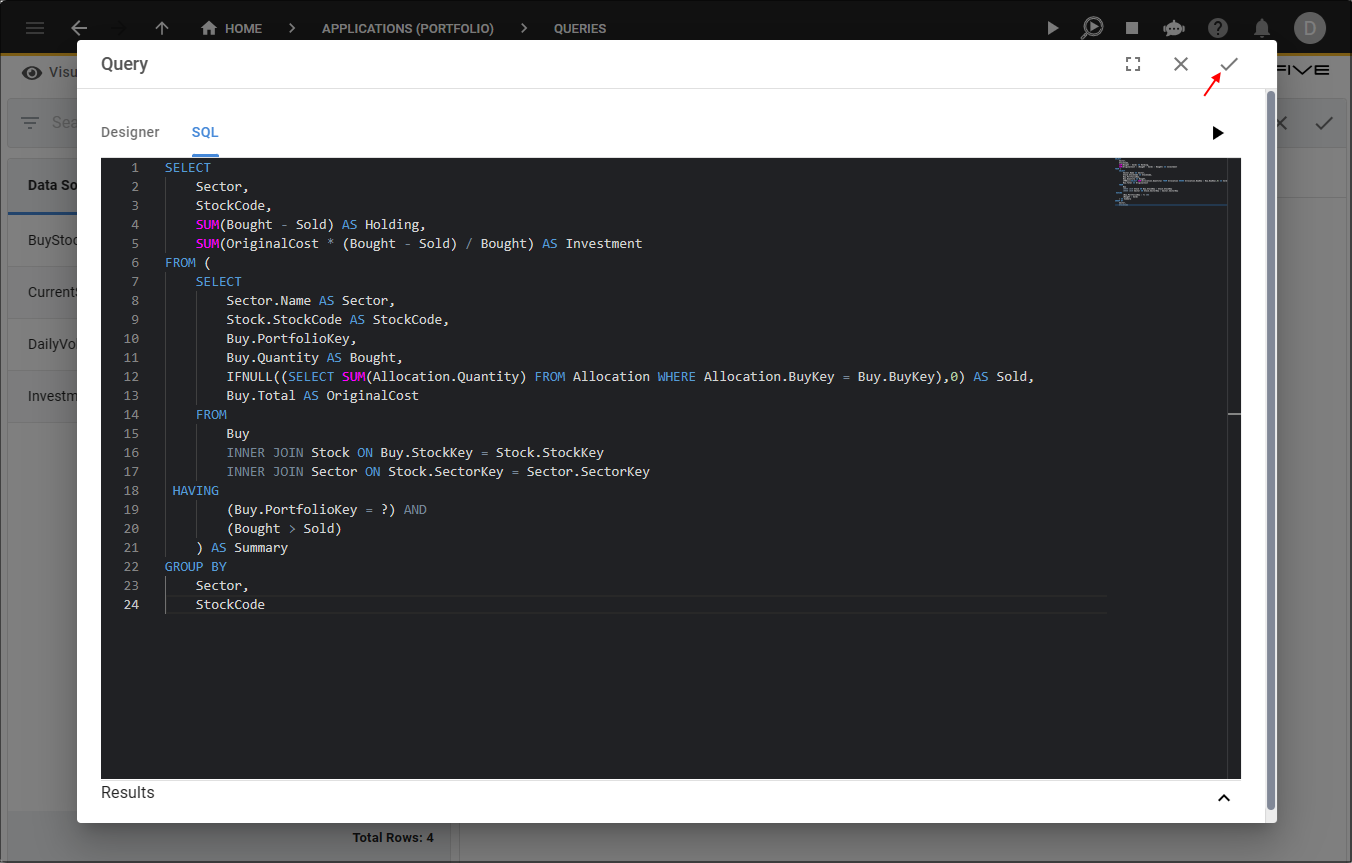
Figure 19 - Save button
6. Click the Save button in the form app bar.
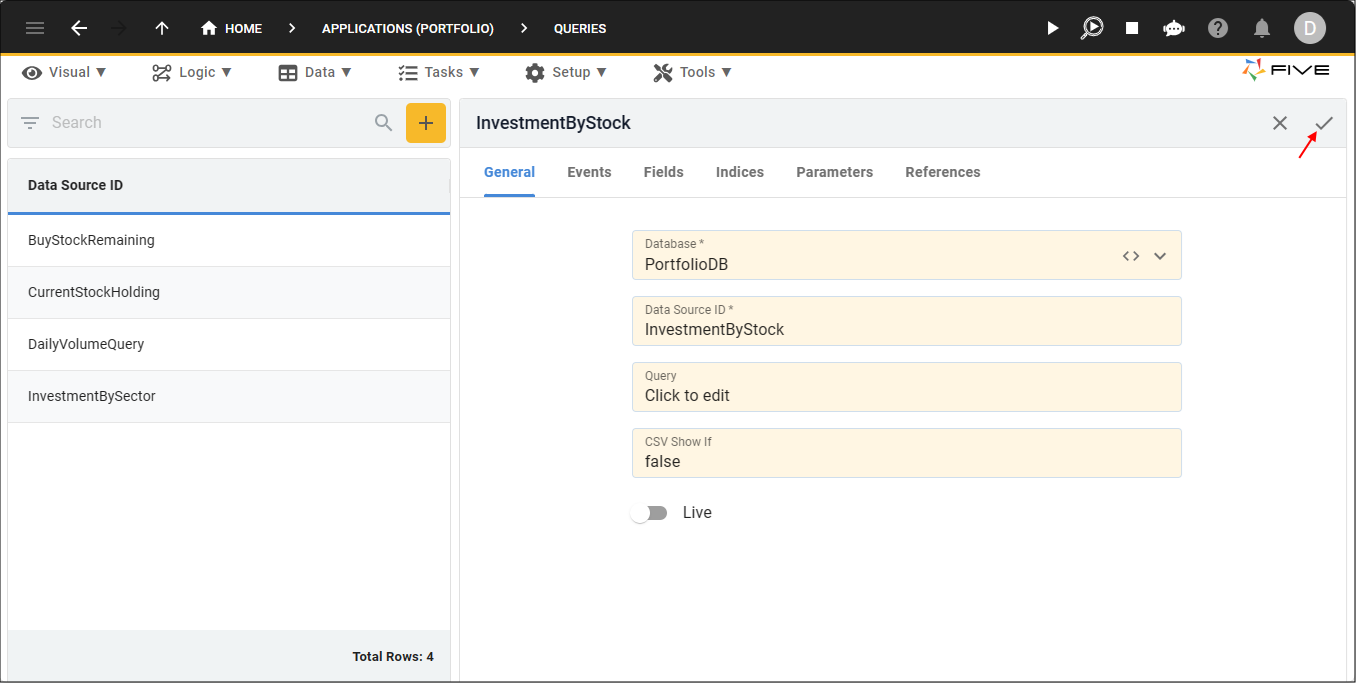
Figure 20 - Save button
info
All the field and the parameter records have been copied from the InvestmentBySector query. You can check this by clicking the Fields and Parameters tabs.
Navigate to the Chart Wizard
info
Five's Chart Wizard will be used to add the Investment Analysis chart with its first chart area. This is only because it is quicker and
a preview is available, you can make the chart and its chart areas all in the Charts view if you wanted to.
1. Click Visual in the menu.
2. Click Chart Wizard in the sub-menu.
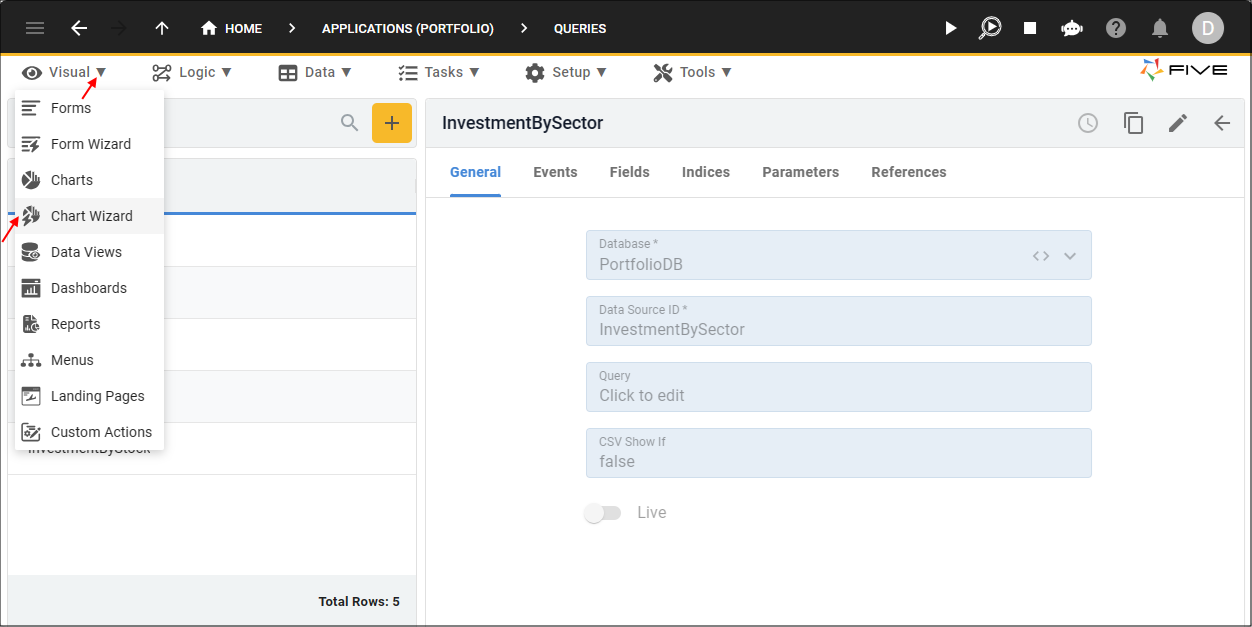
Figure 21 - Chart Wizard menu item
Add the Investment Analysis Chart
1. Type Investment Analysis in the Chart Title field.2. Click the lookup icon in the Data Source field and select InvestmentBySector.
3. Click the lookup icon in the X Value Column and select Sector.
4. Click the lookup icon in the Y Value Column and select Investment.
5. Type InvestmentBySector in the Chart Area ID field.
6. Type Investment by Sector in the Chart Area Title field.
7. Click the Show Chart Area Title switch.
8. Click the lookup icon in the Chart Type field and select Pie.
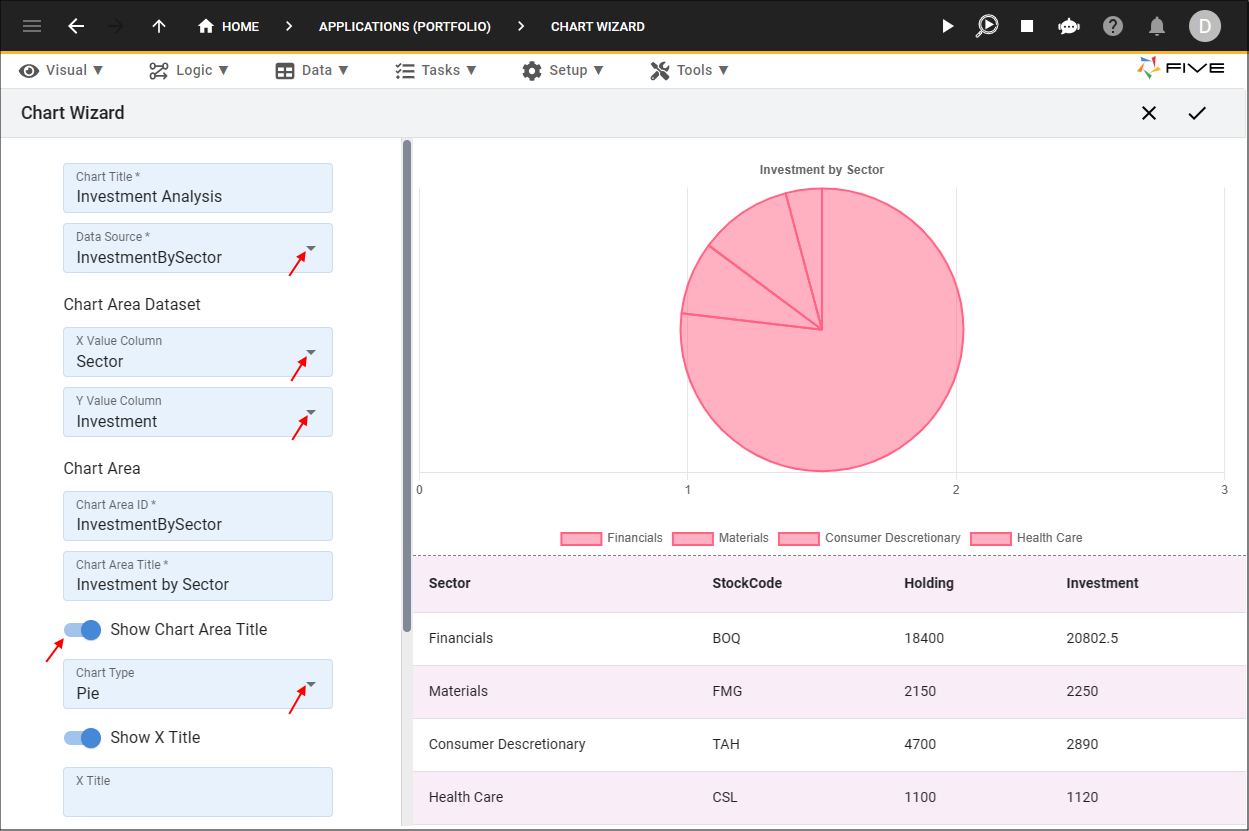
Figure 22 - Add the Investment Analysis chart
9. Click in the Color List Picker field.
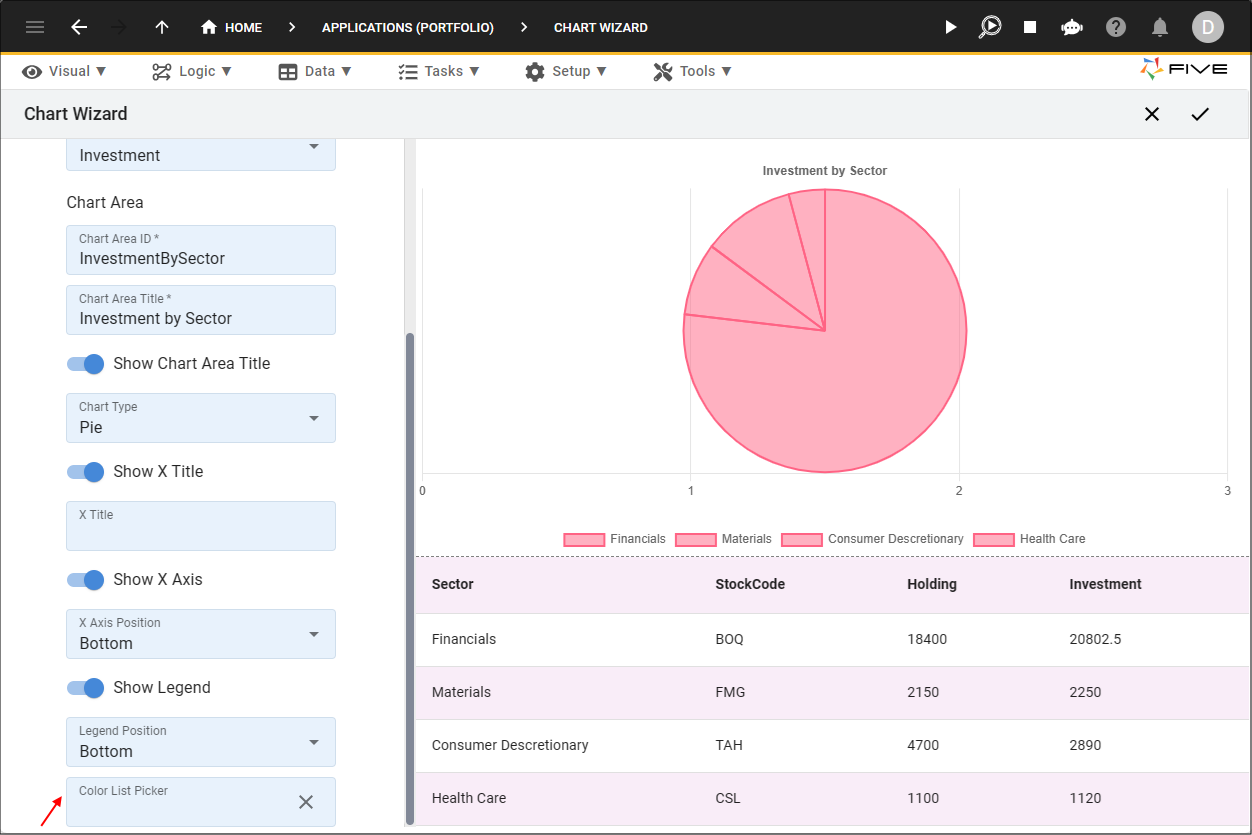
Figure 23 - Color List Picker field
10. Select a color block.
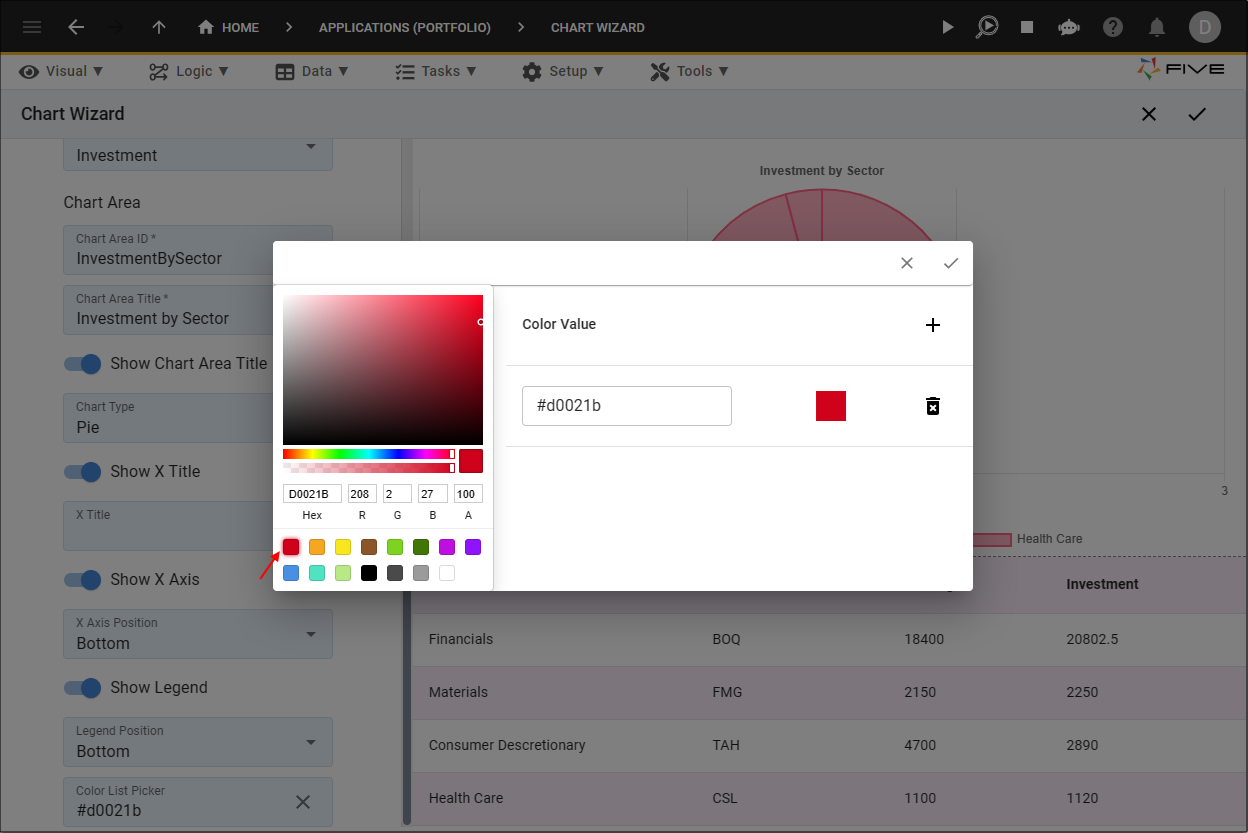
Figure 24 - Color Picker
info
If you want multiple colors for your pie chart, you will need to continue to select more colors.
11. Click the Add New Color button and select another color block.
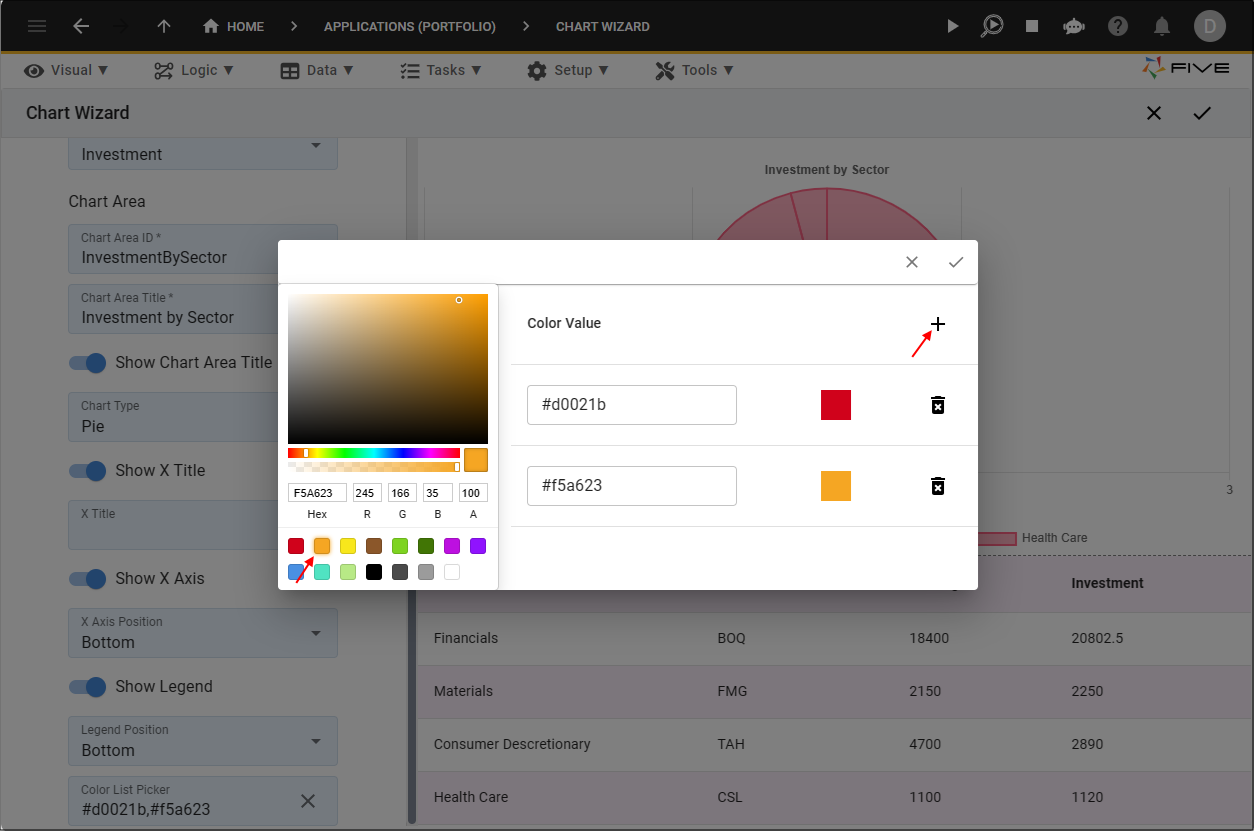
Figure 25 - Add New Color button
12. Repeat step 11 to add another 2 colors.
13. Click the Save button in the Color Picker app bar.
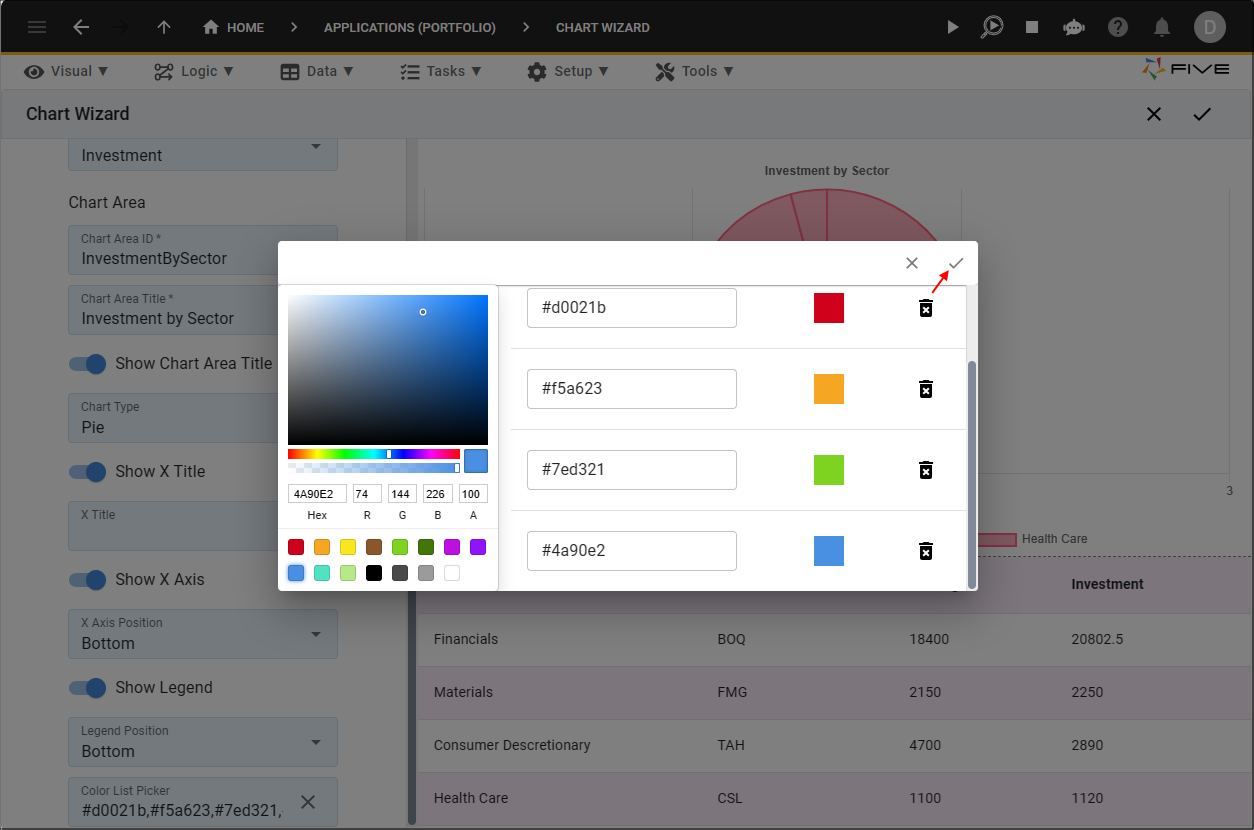
Figure 26 - Save button
14. Click the Save button in the Chart Wizard app bar.
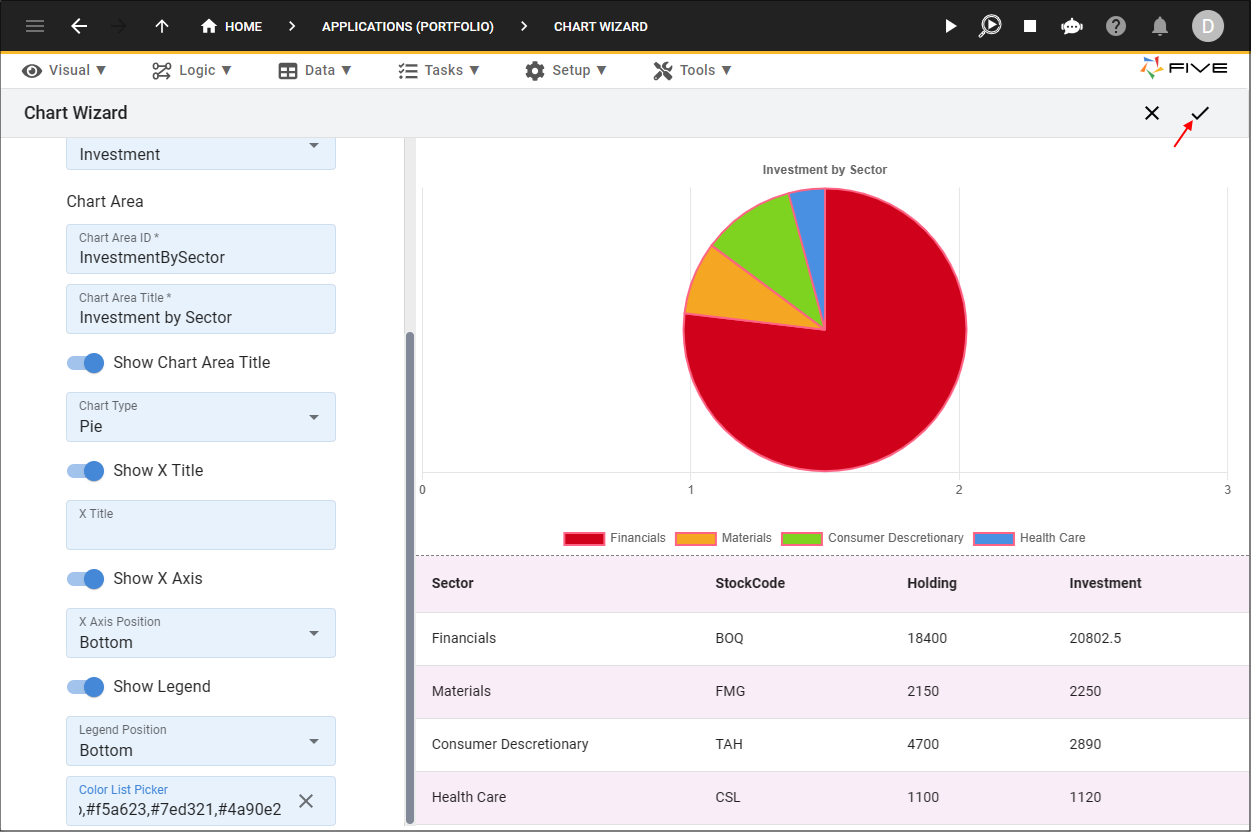
Figure 27 - Save button
Navigate to Charts
info
We will need to edit the Investment Analysis chart record so that we can add the Investment by Stock chart area.
1. Click Visual in the menu.
2. Click Charts in the sub-menu.
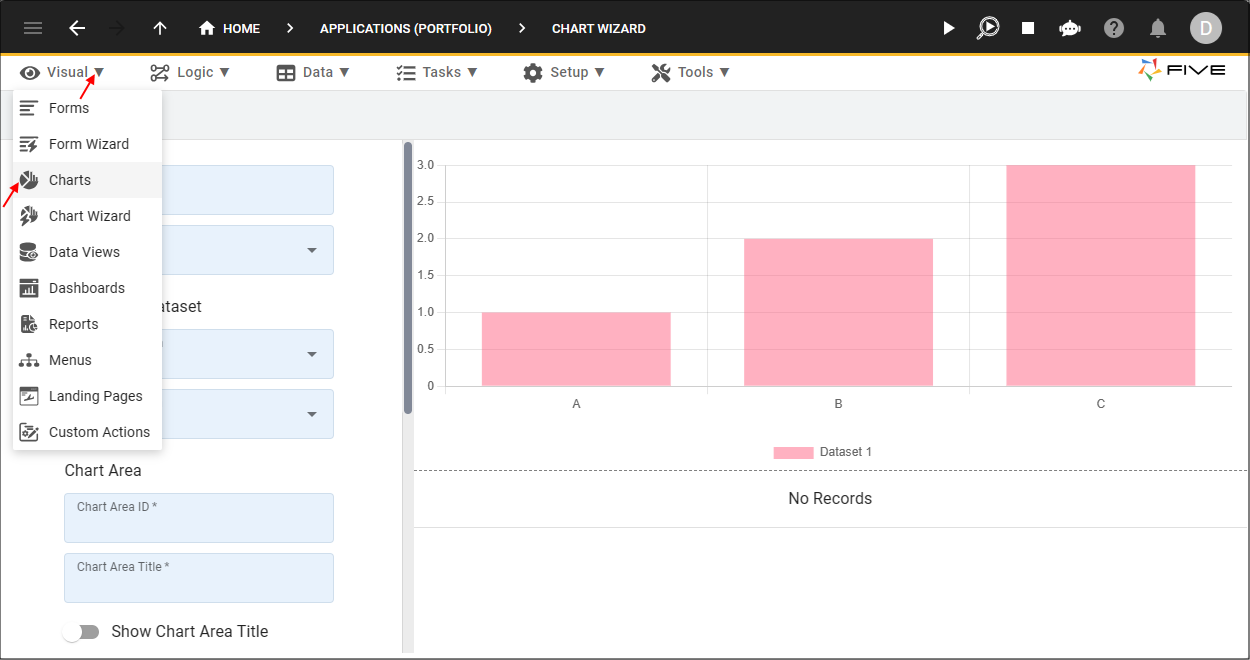
Figure 28 - Charts menu item
Edit the Investment Analysis Chart
1. Select the Investment Analysis record in the list.2. Either click the Edit button in the form app bar, or click directly in Columns field.
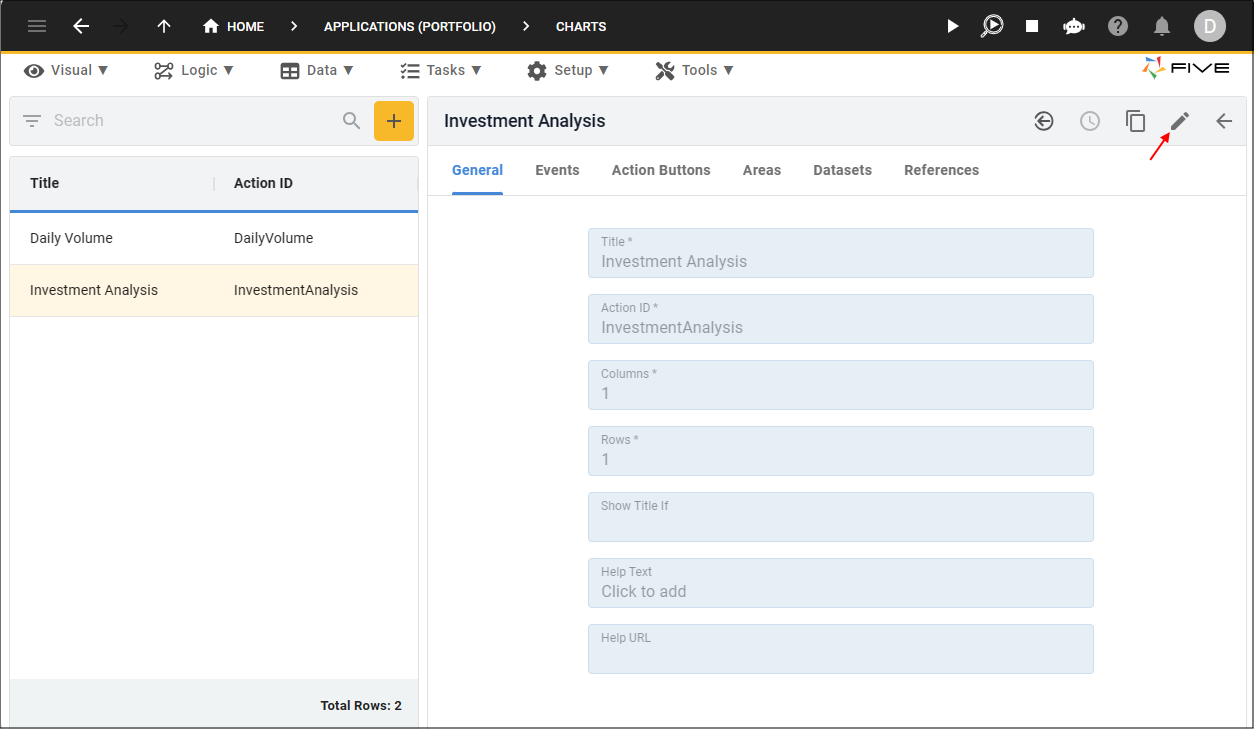
Figure 29 - Edit button
3. Click the Cancel button in the Columns field and type 2.
4. Type
true
in the Show If field.
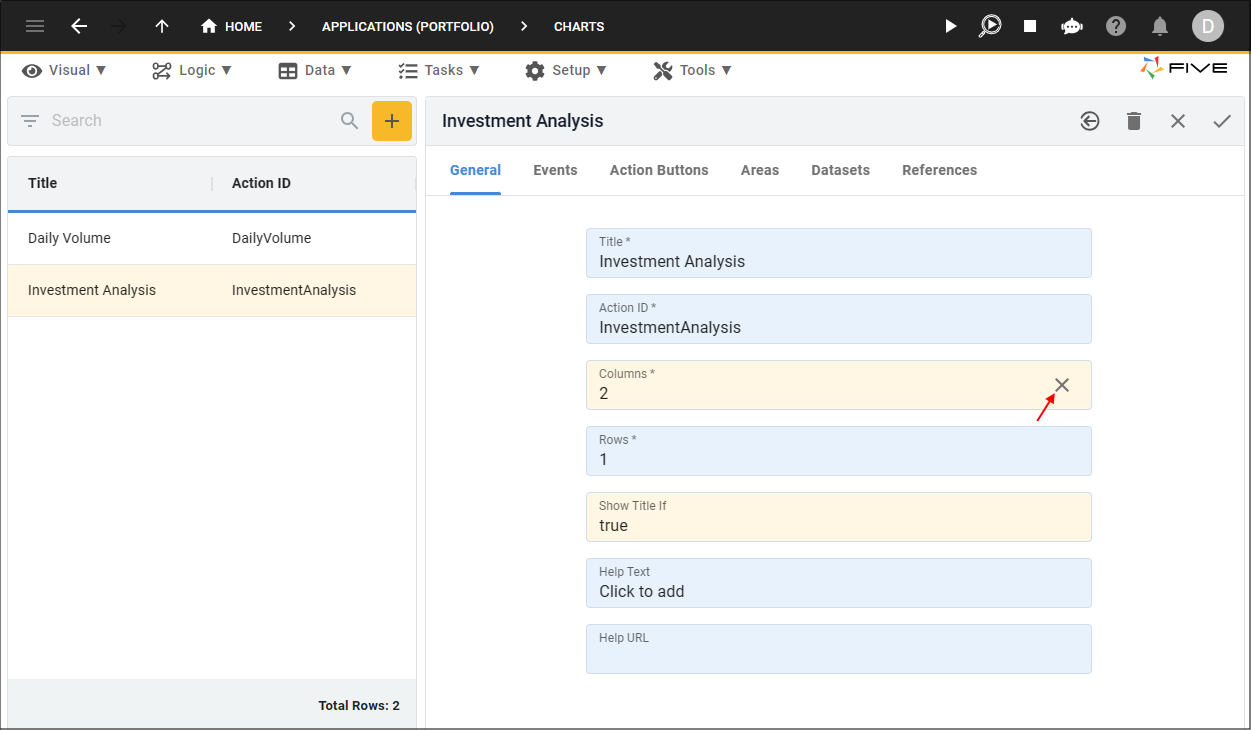
Figure 30 - Edit the Investment Analysis chart
Add the Investment by Stock Area
info
The Areas page enables you to add multiple charts to the one chart view.
5. Click the Areas tab.
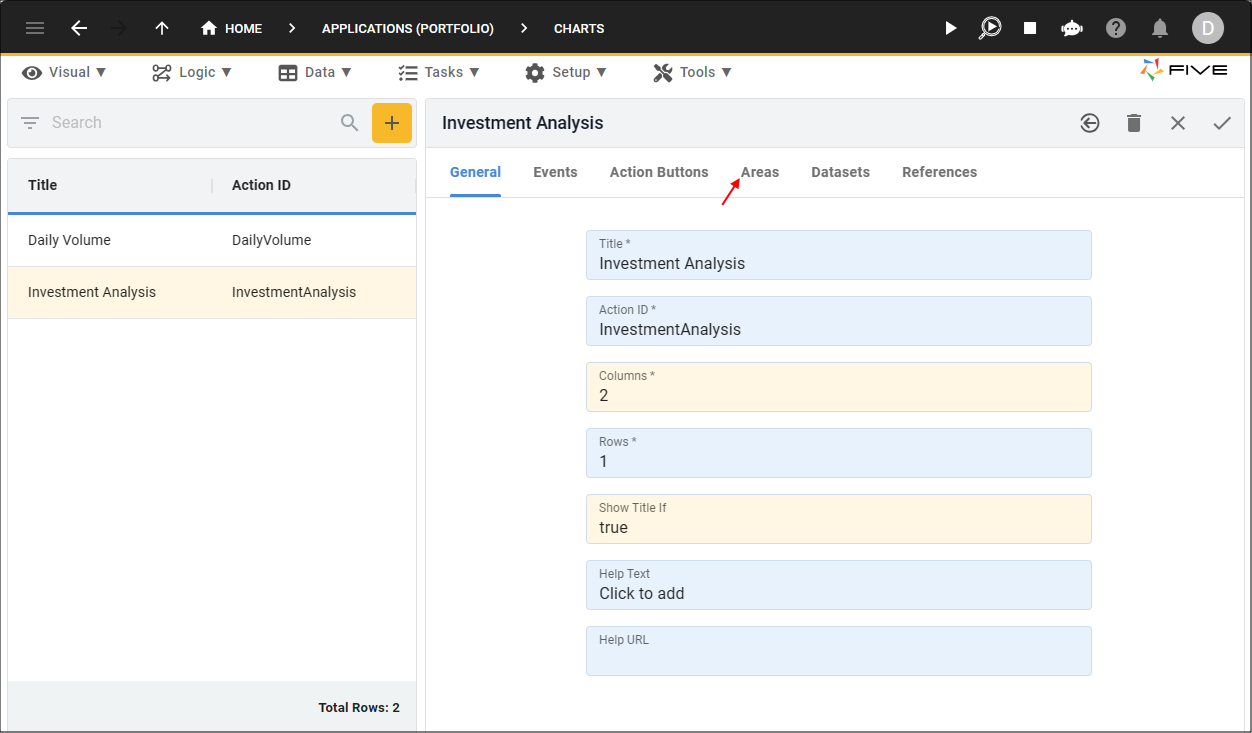
Figure 31 - Areas tab
6. Click the Add Areas button.
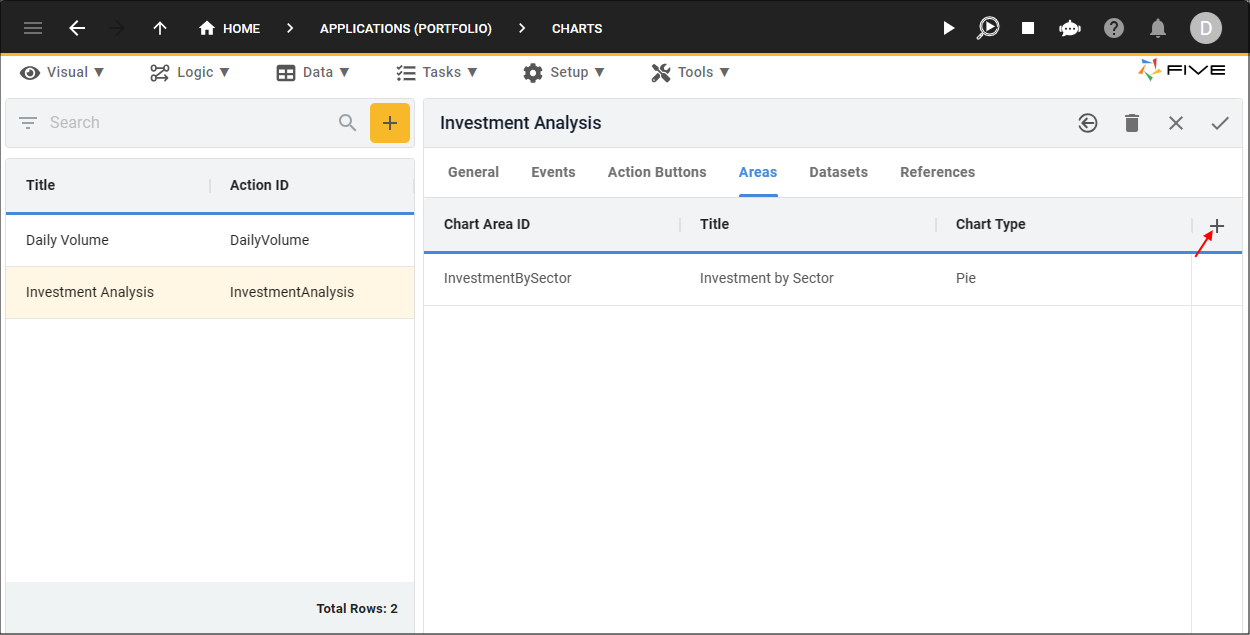
Figure 32 - Add Areas button
7. Type InvestmentByStock in the Chart Area ID field.
8. Type Investment by Stock in the Title field.
9. Click the lookup icon in the Chart Type field and select Pie.
10. Click the Edit button in the Page Position field.
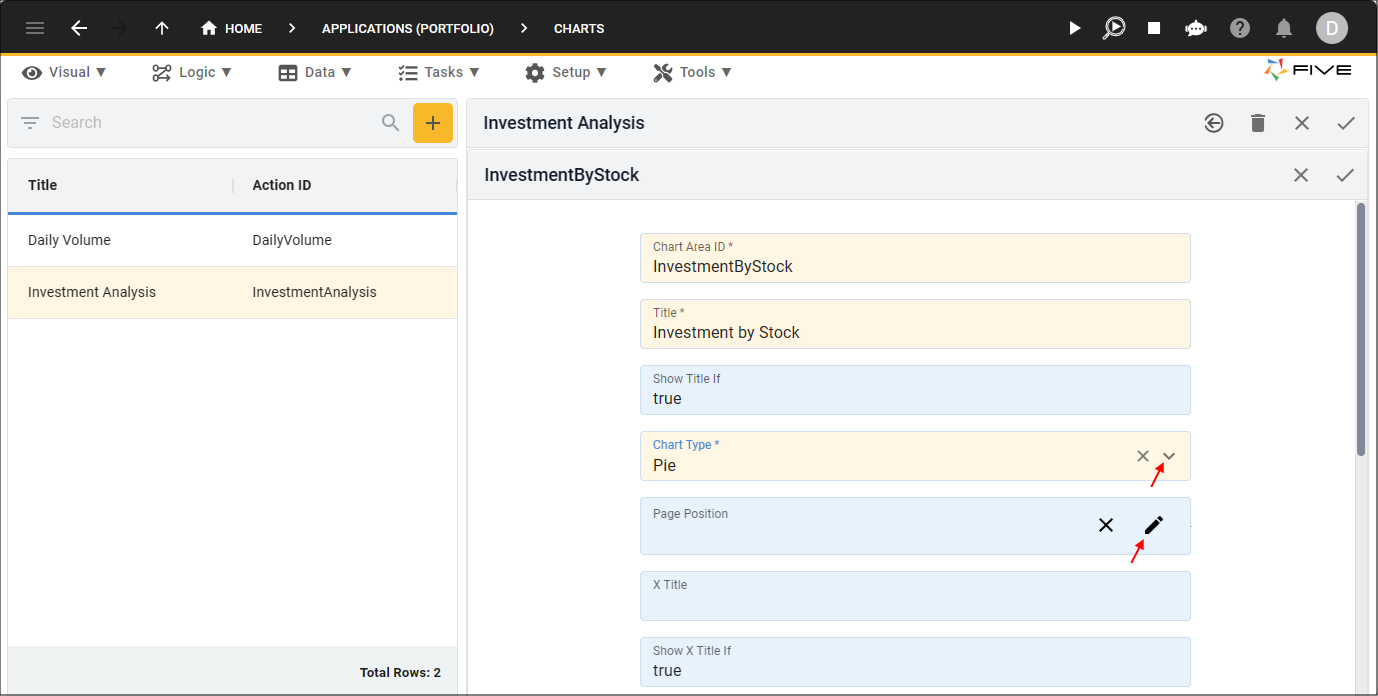
Figure 33 - Add the Investment by Stock chart area
11. Select the B1 position.
12. Click the Save button in the Grid Picker.
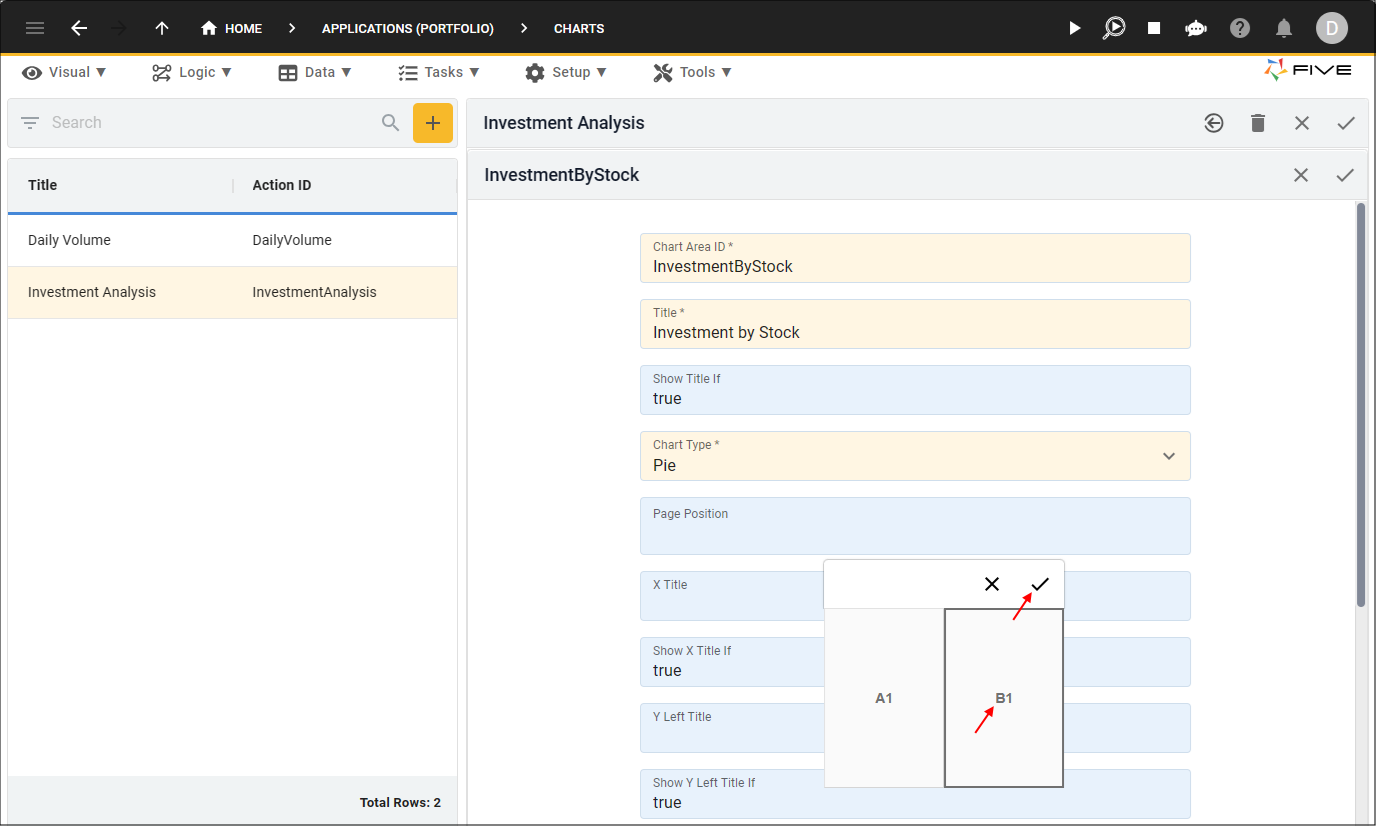
Figure 34 - Grid Picker
13. Click in the Color List field.
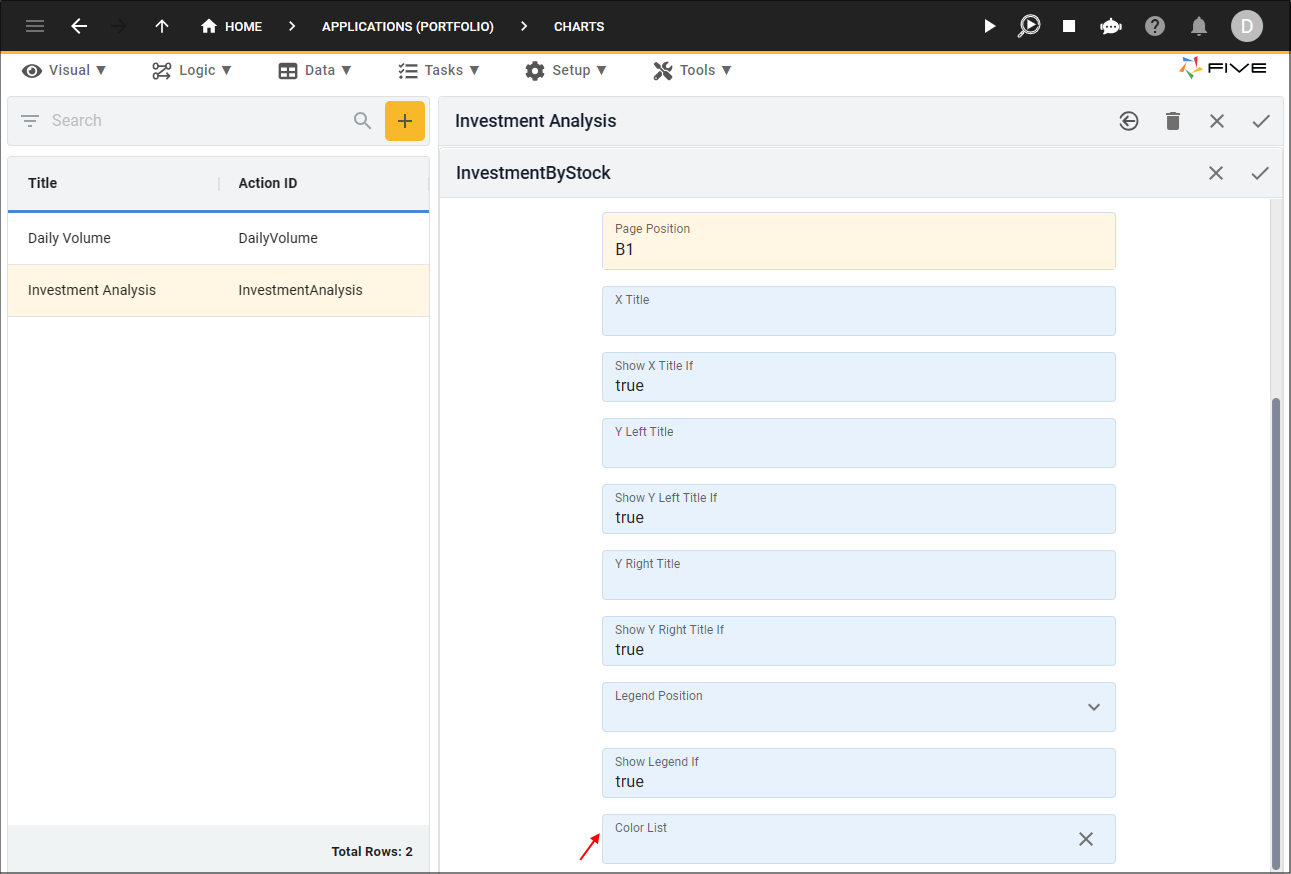
Figure 35 - Color List field
14. Click a color block
15. Click the Add New Color button.
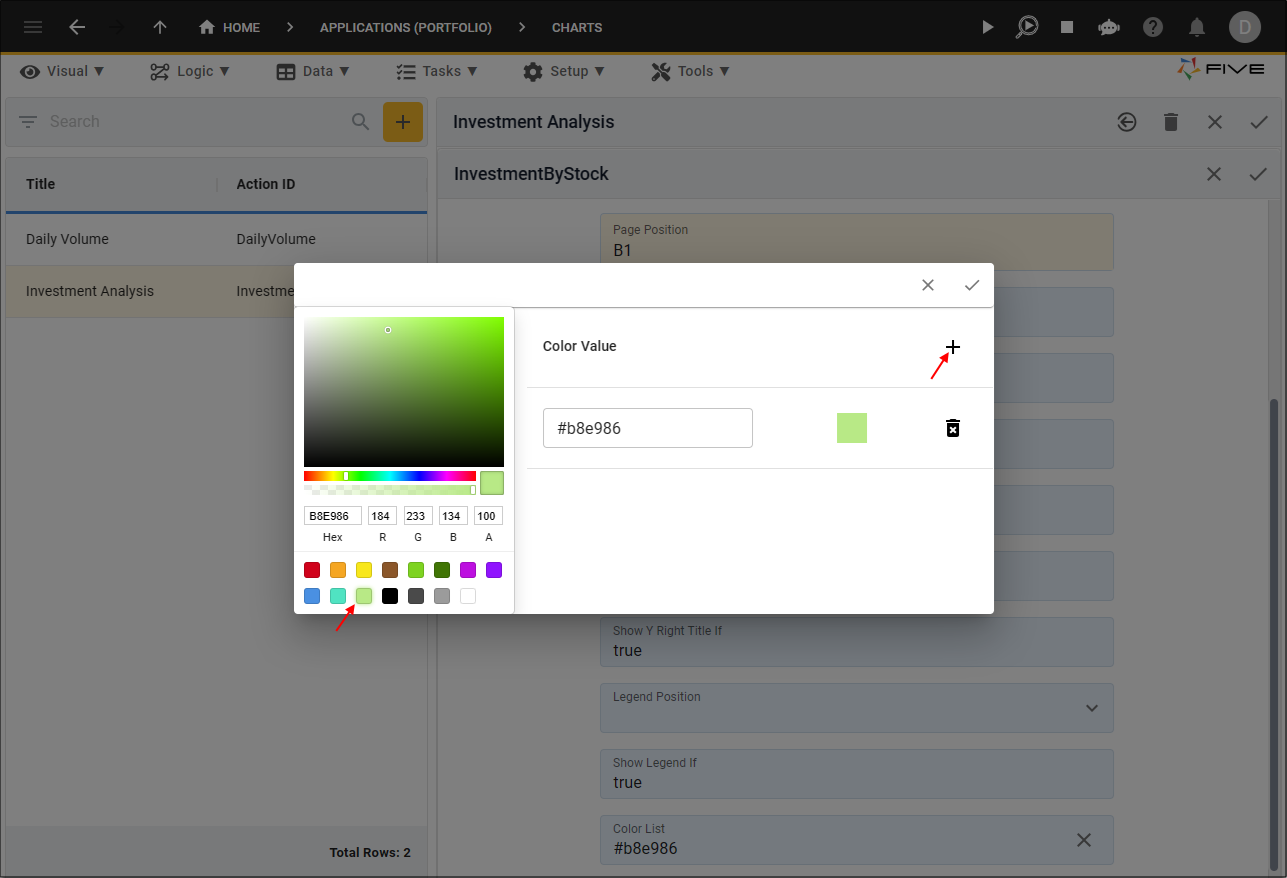
Figure 36 - Color Picker
16. Repeat steps 14 and 15 to add several more colors.
17. Click the Save button in the Color Picker app bar.
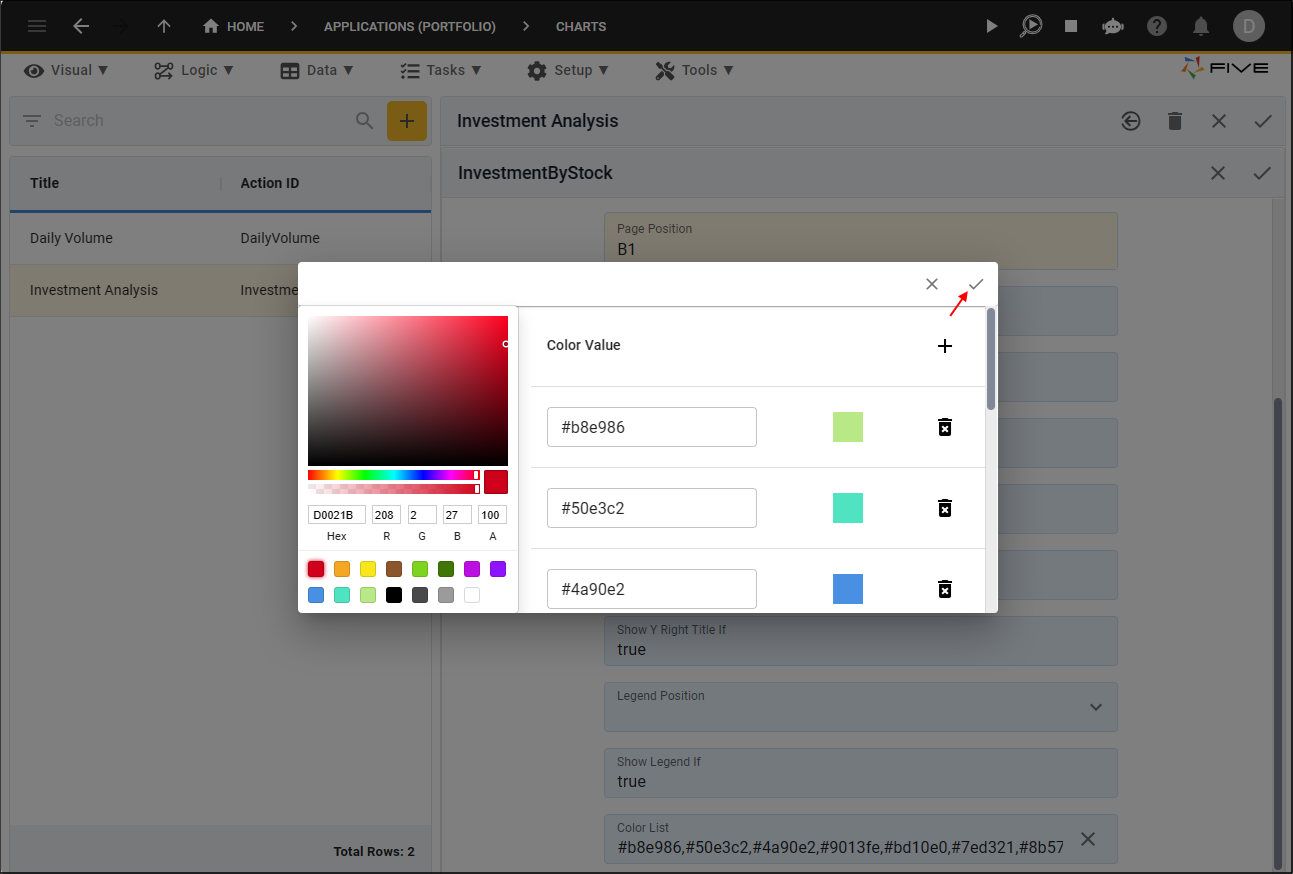
Figure 37 - Save button
18. Click the Save button in the form app bar.
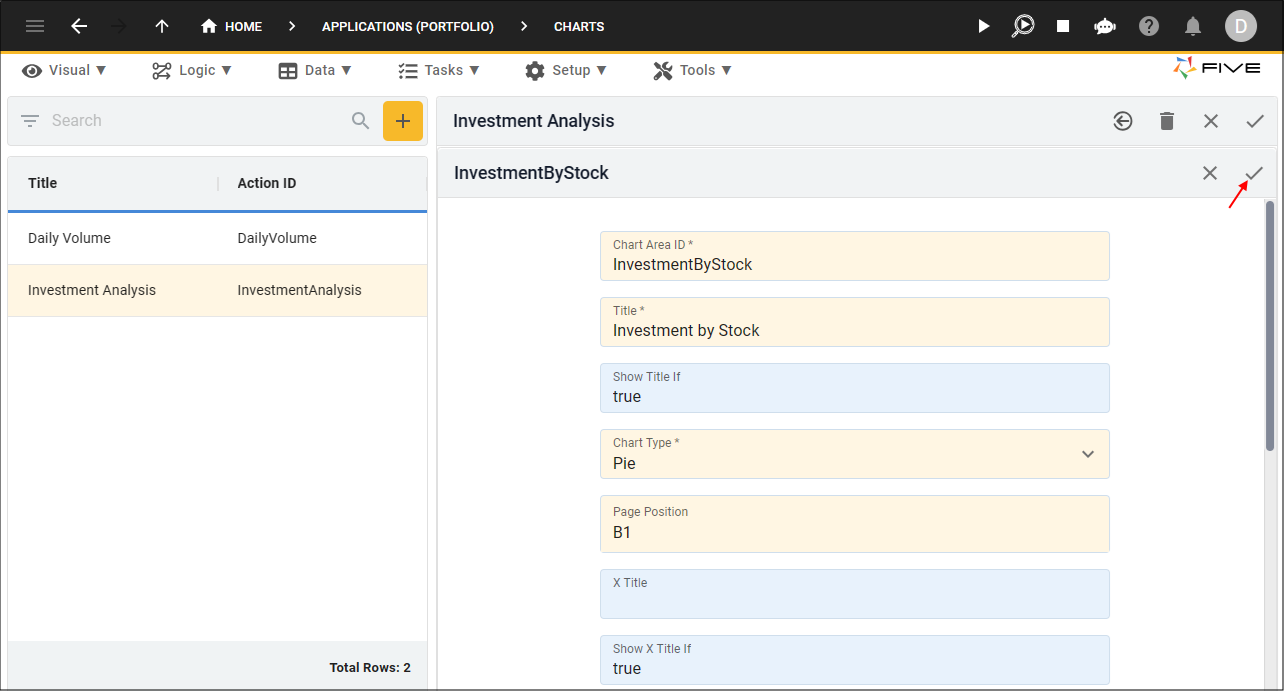
Figure 38 - Save button
Add the InvestmentByStock Data Source
info
The Datasets page enables you to pick a data source to supply the data to your chart.
19. Click the Datasets tab.
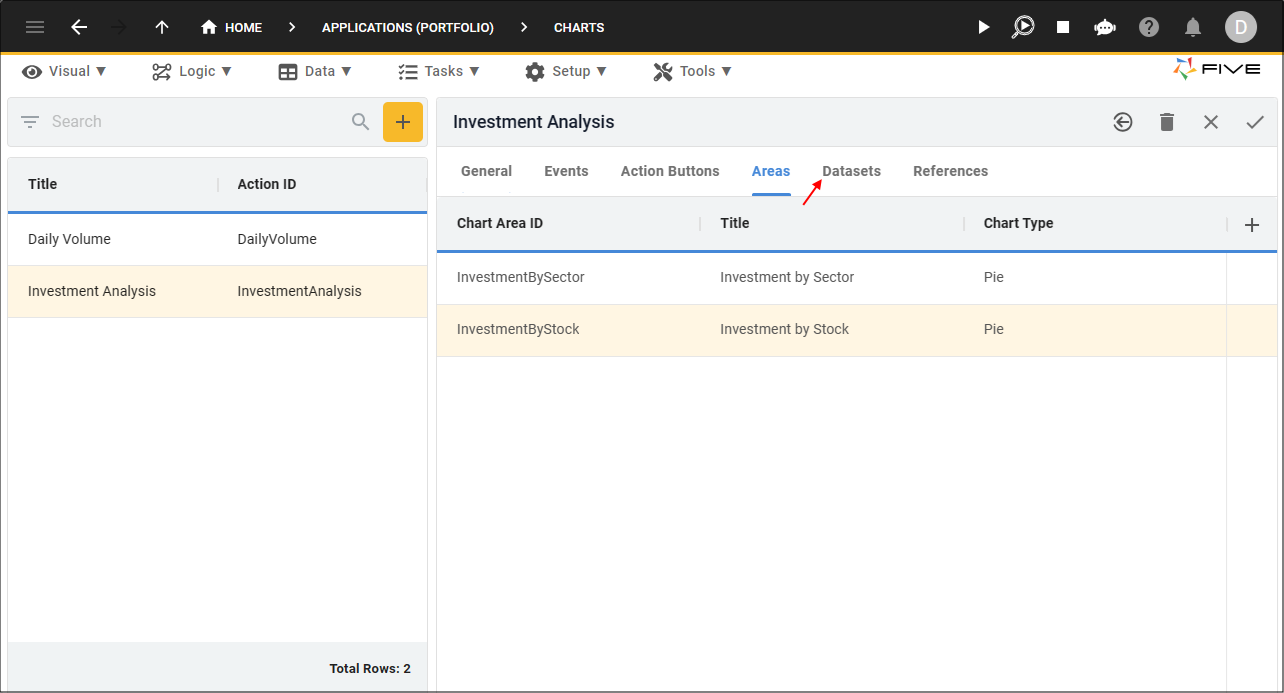
Figure 39 - Datasets tab
20. Click the Add Datasets button.
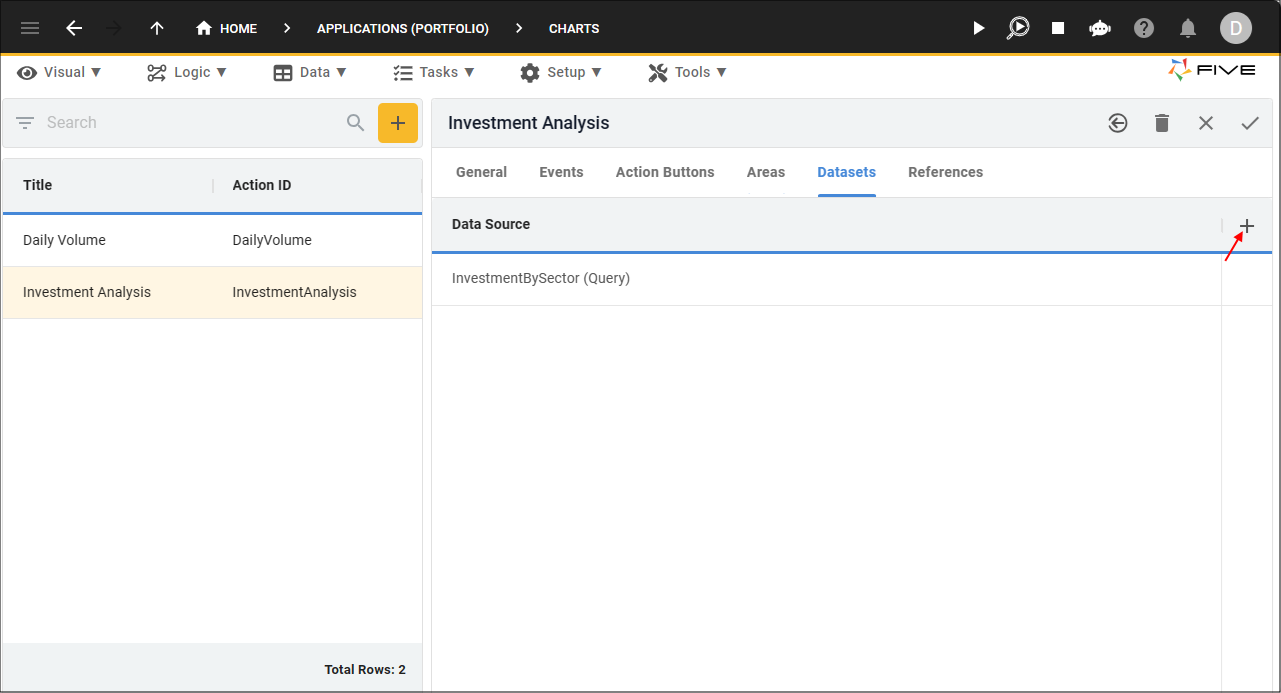
Figure 40 - Add Datasets button
21. Click the lookup icon in the Data Source field and select InvestmentbyStock (Query).
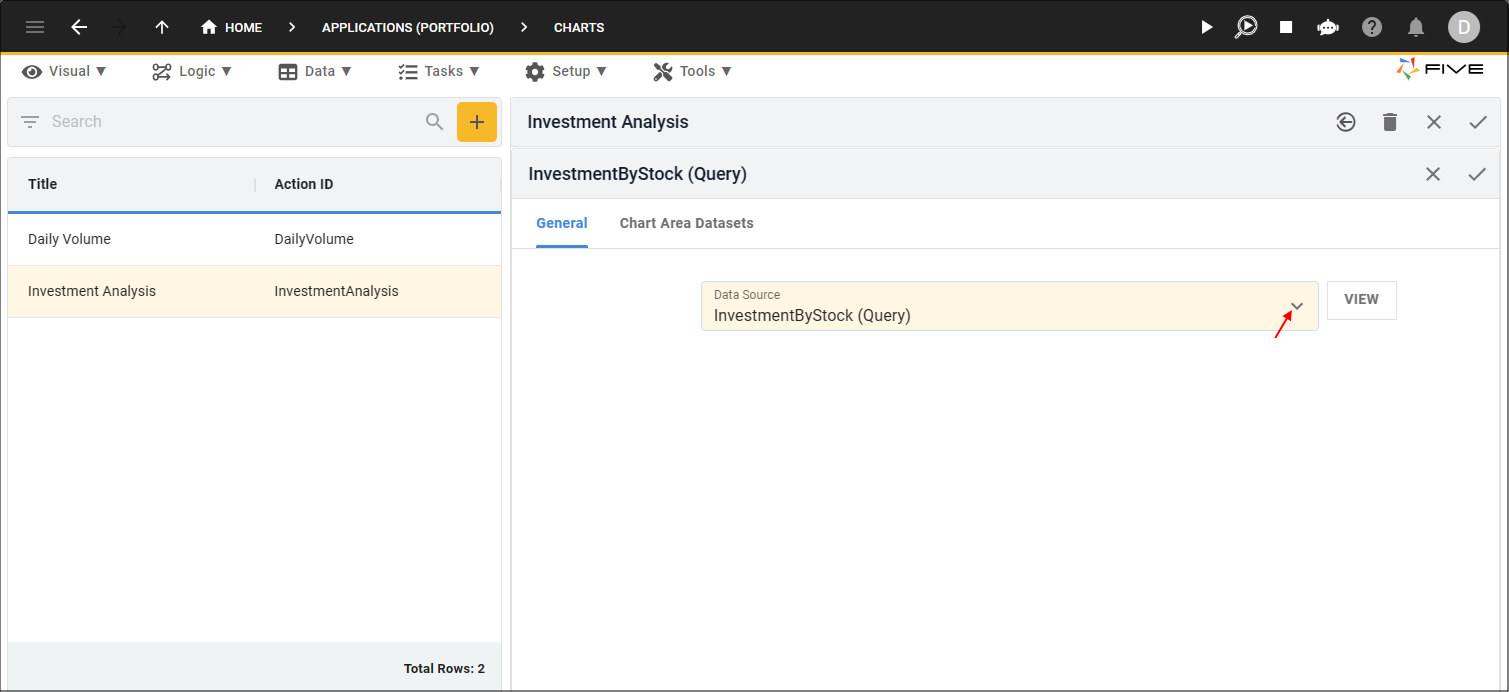
Figure 41 - Data Source field
Add the Investment by Stock Chart Area Dataset
info
The Chart Area Datasets page enables you to select the fields required to return the results.
22. Click the Chart Area Datasets tab.
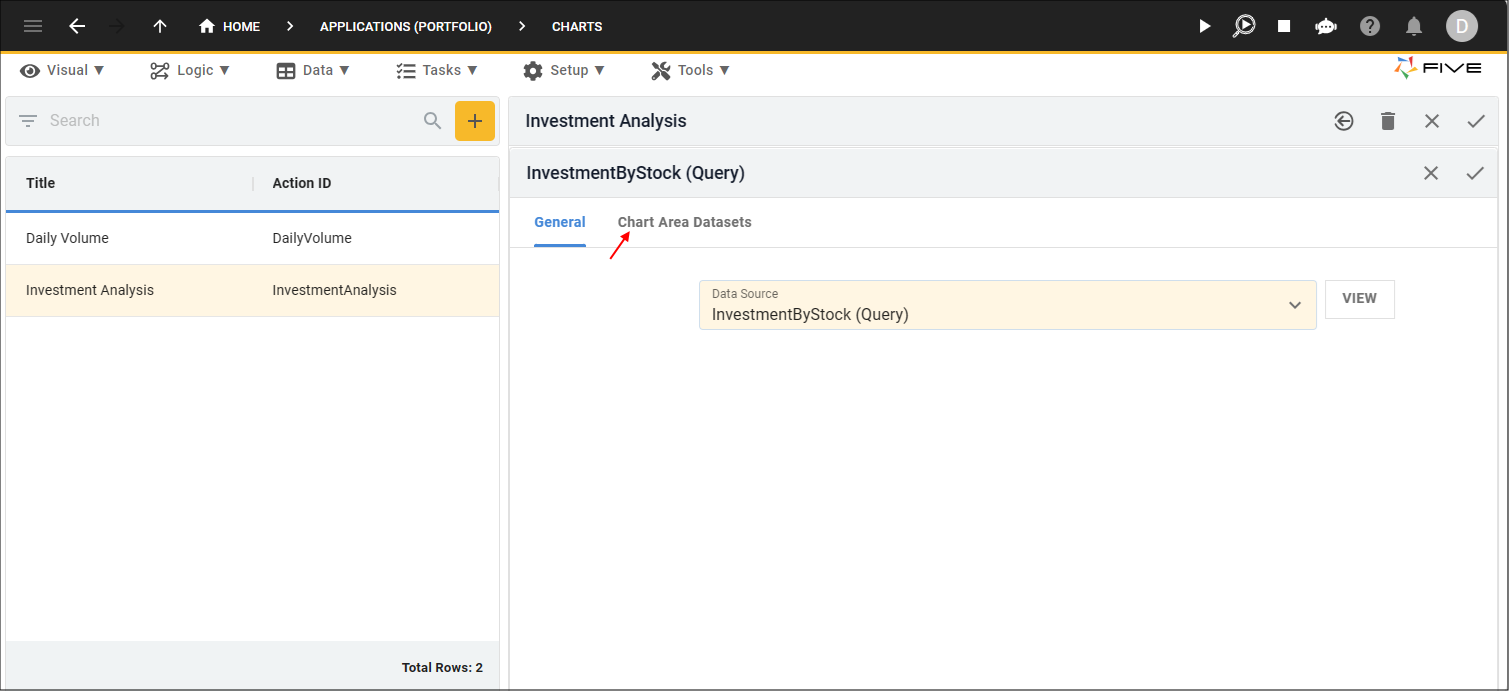
Figure 42 - Chart Area Datasets tab
23. Click the Add Chart Area Datasets button.
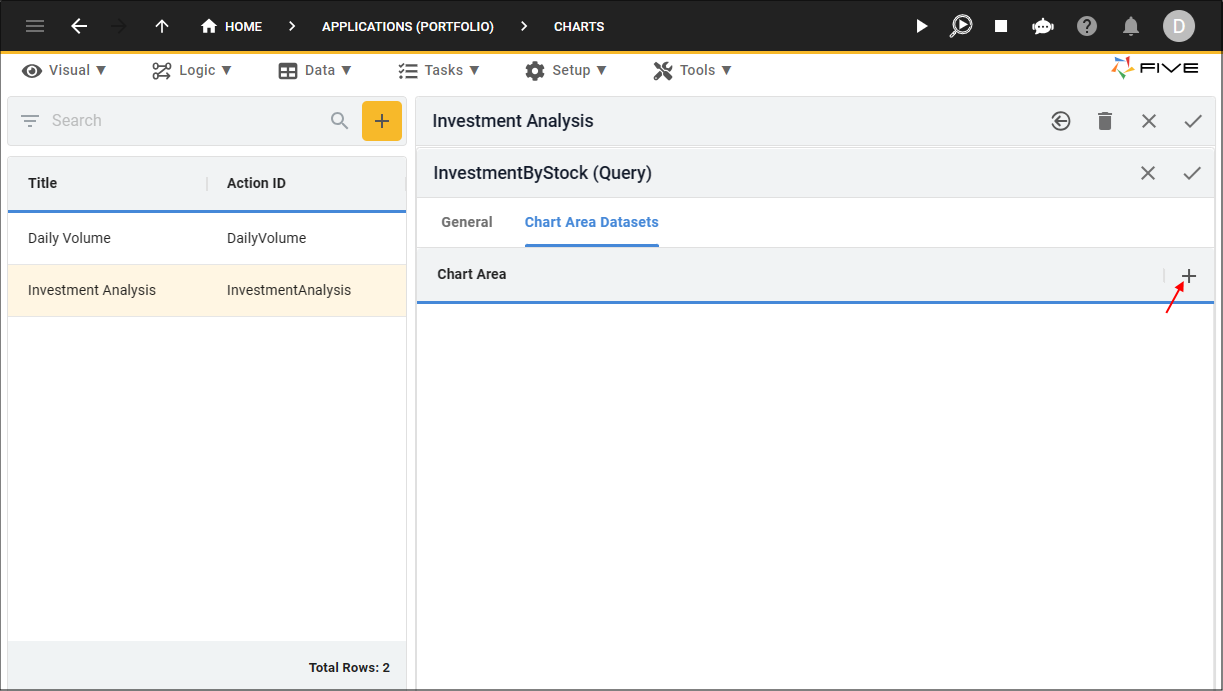
Figure 43 - Add Chart Area Datasets button
24. Click the lookup icon in the Chart Area field and select Investment by Stock.
25. Click the lookup icon in the X Value Column and select StockCode.
26. Click the lookup icon in the Y Value Column and select Investment.
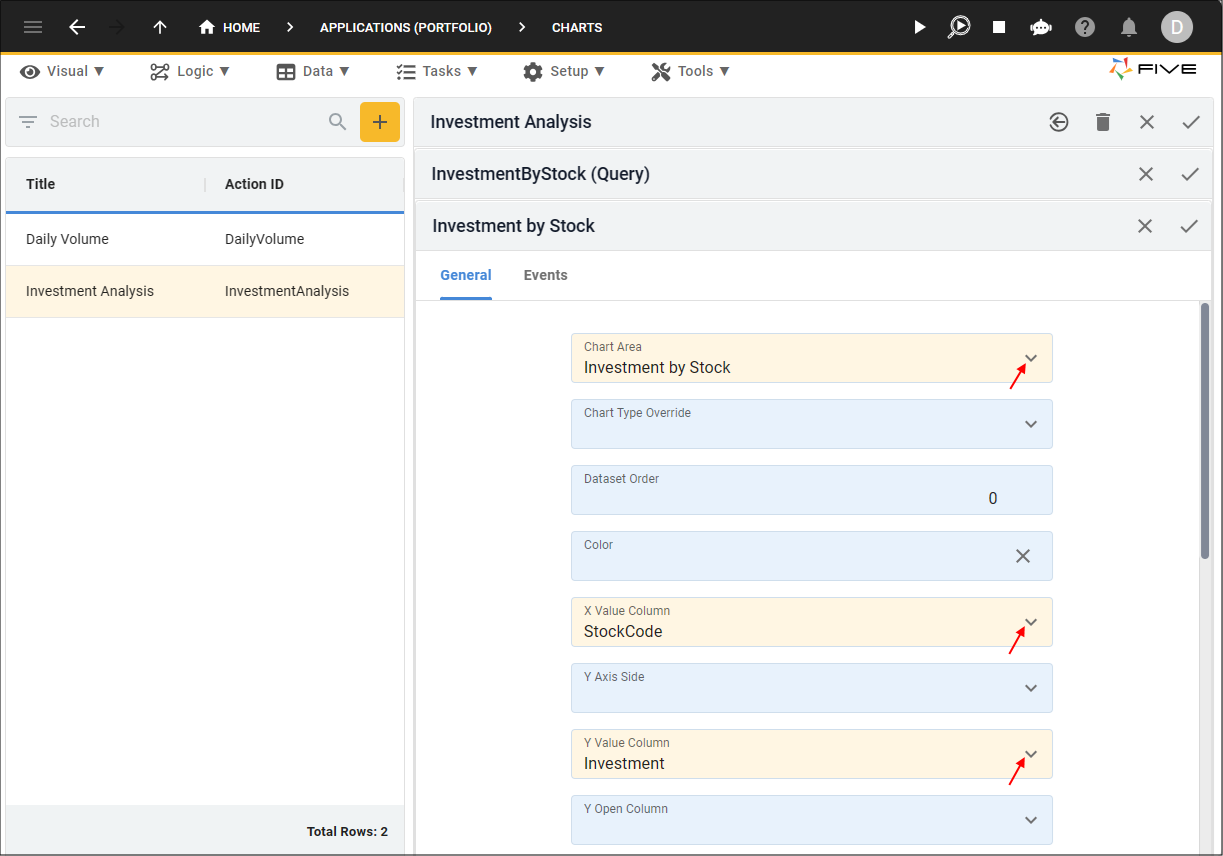
Figure 44 - Add the Investment by Stock chart area dataset
27. Click the Save button in the form app bar.
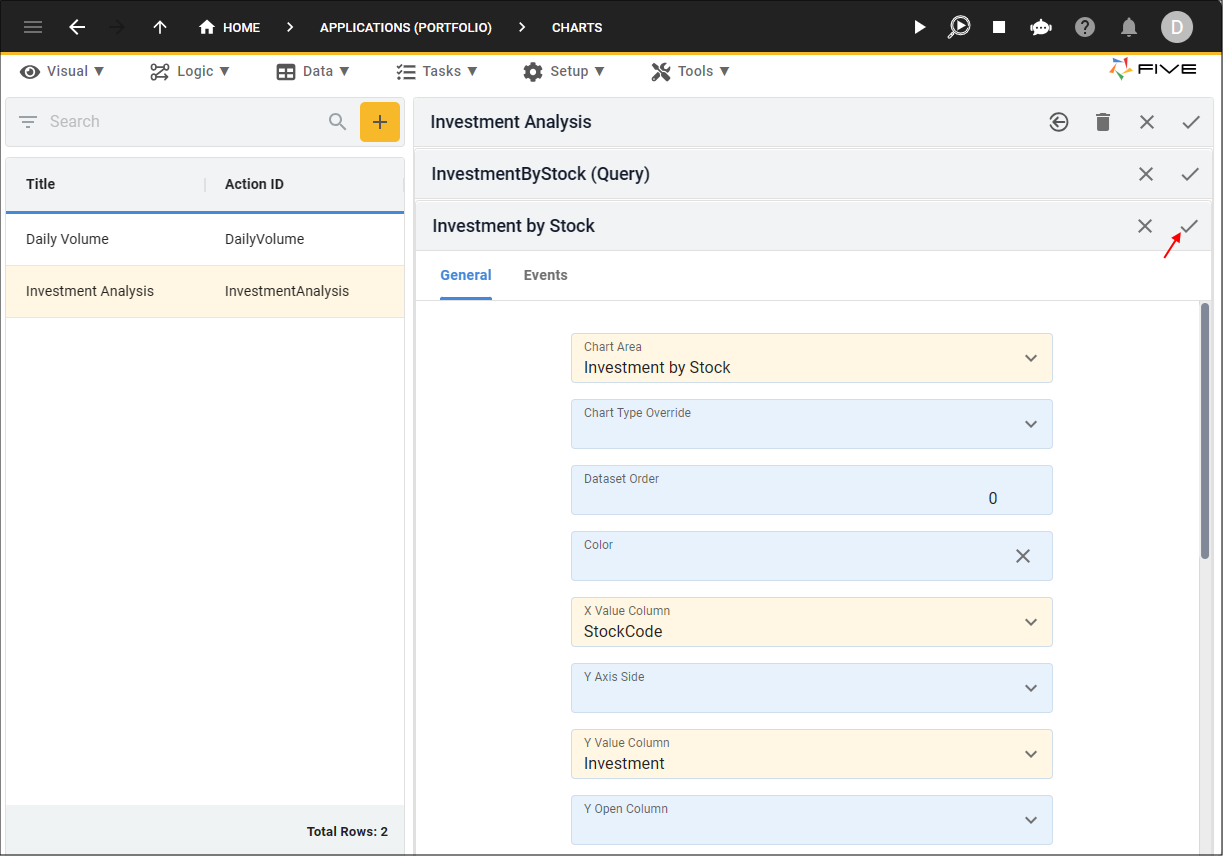
Figure 45 - Save button
28. Click both Save buttons in the stacked form app bars above the list.
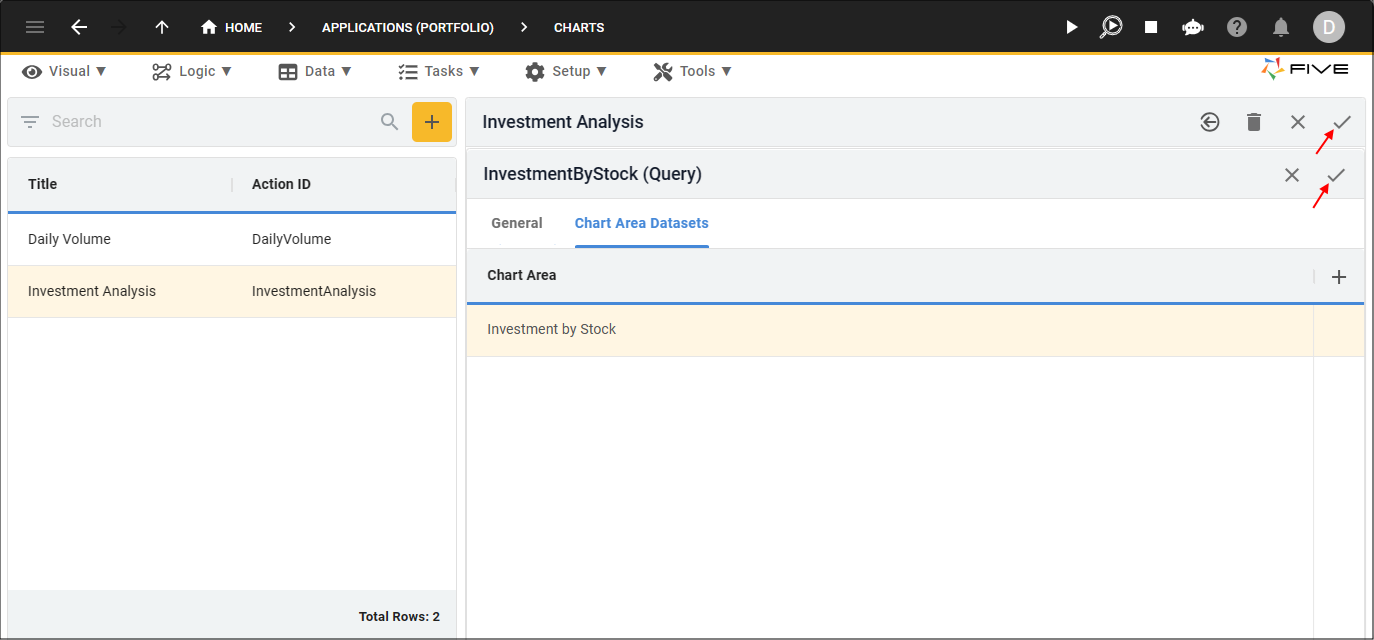
Figure 46 - Save buttons
Navigate to Menus
info
In order to view the Investment Analysis chart in the Portfolio application, we need to add a menu item for it.
1. Click Visual in the menu.
2. Click Menus in the sub-menu.
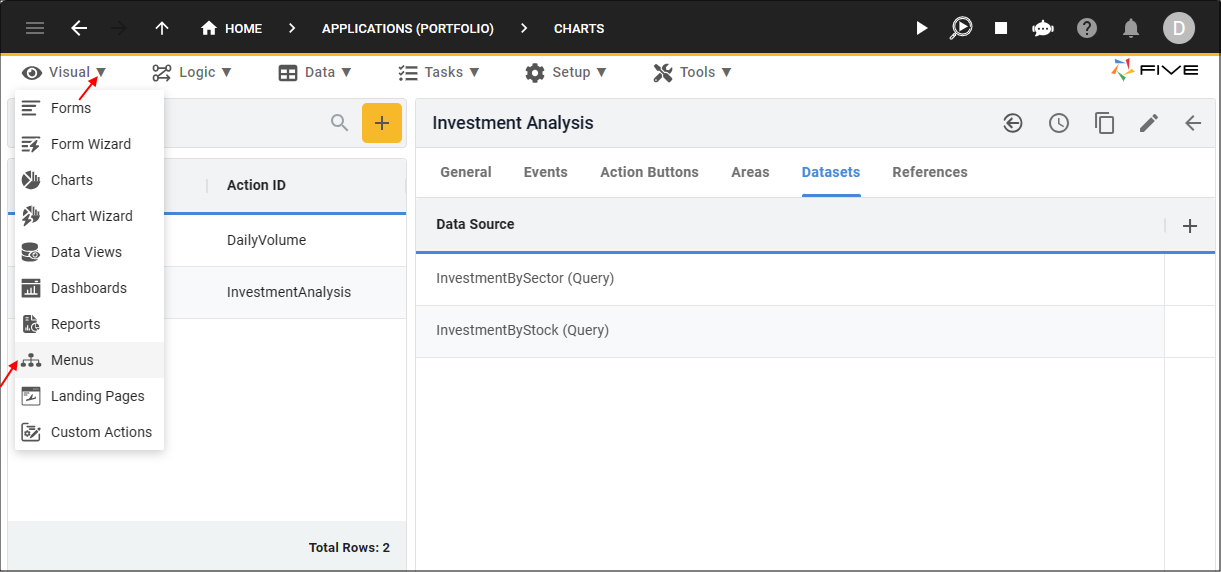
Figure 47 - Menus menu item
Add the Investment Analysis Menu
1. Click the Add Item button.2. Type Investment Analysis in the Caption field.
3. Type 1 in the Menu Order field.
4. Click the lookup icon in the Action field and select InvestmentAnalysis (Chart).
5. Click the lookup icon in the Parent Menu field and select Portfolios (Portfolios).
6. Optional: Click the edit button in the Icon field and open an image file.
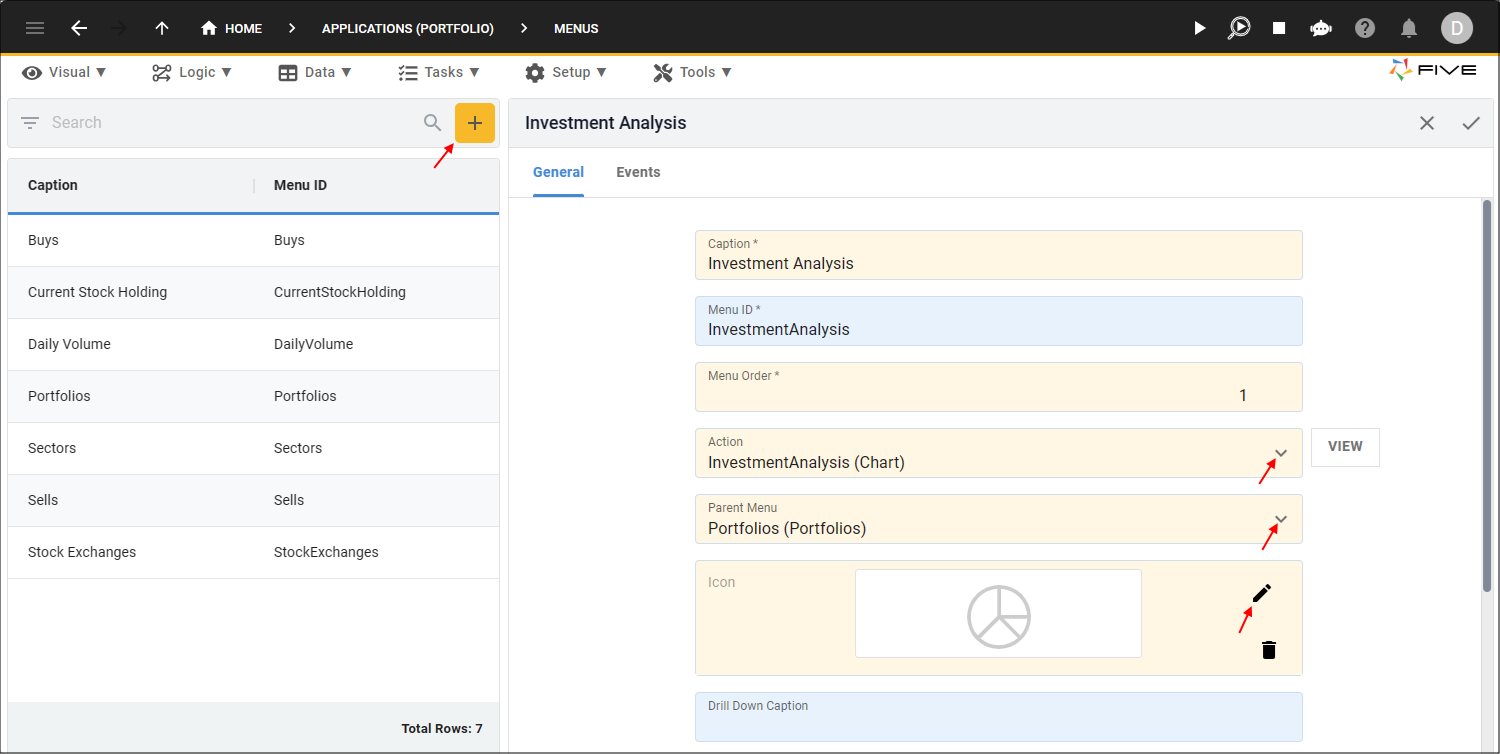
Figure 48 - Add the Investment Analysis menu
7. Click the Save button in the form app bar.

Figure 49 - Save button
Run the Portfolio Application
tip
This is a good time to run your application and see the Investment Analysis Charts!
1. Click the Run button in Five's toolbar.
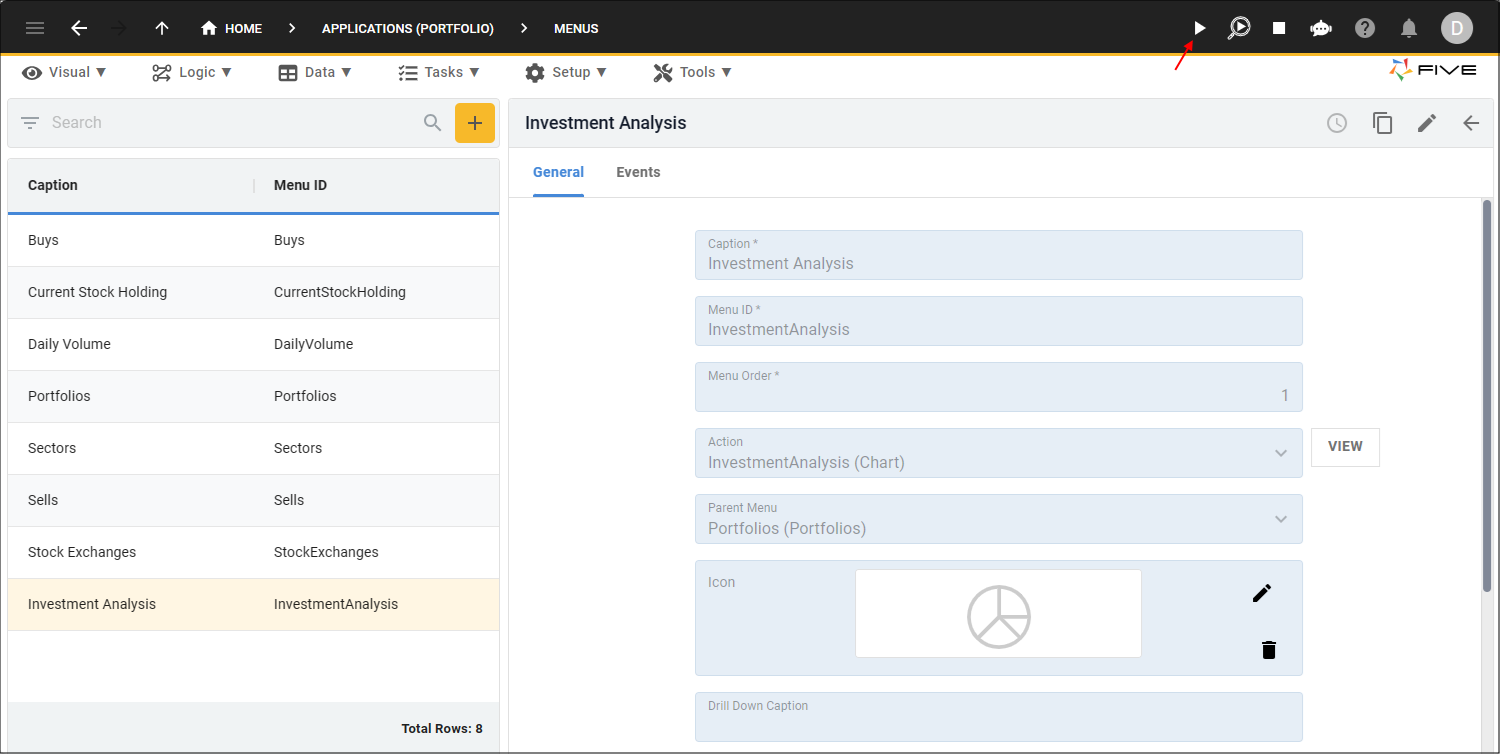
Figure 50 - Run button
2. Select the Growth Portfolio record.
3. Click the Down button in the form app bar.
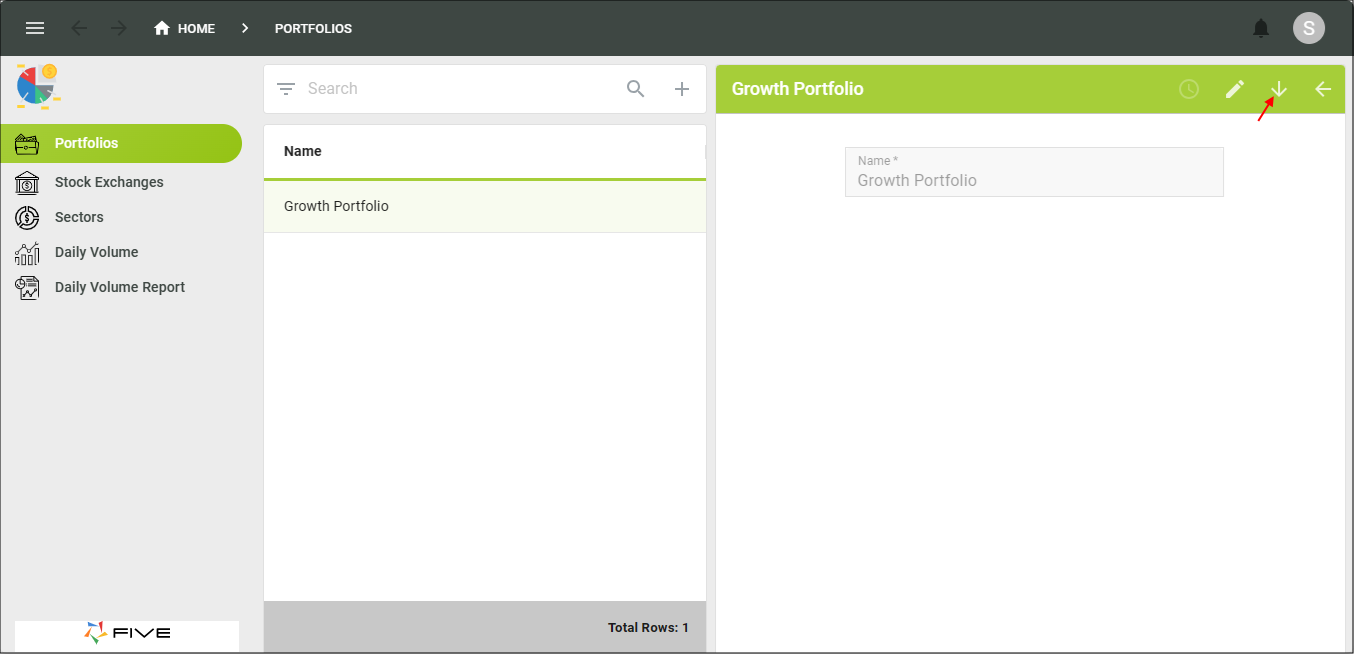
Figure 51 - Down button
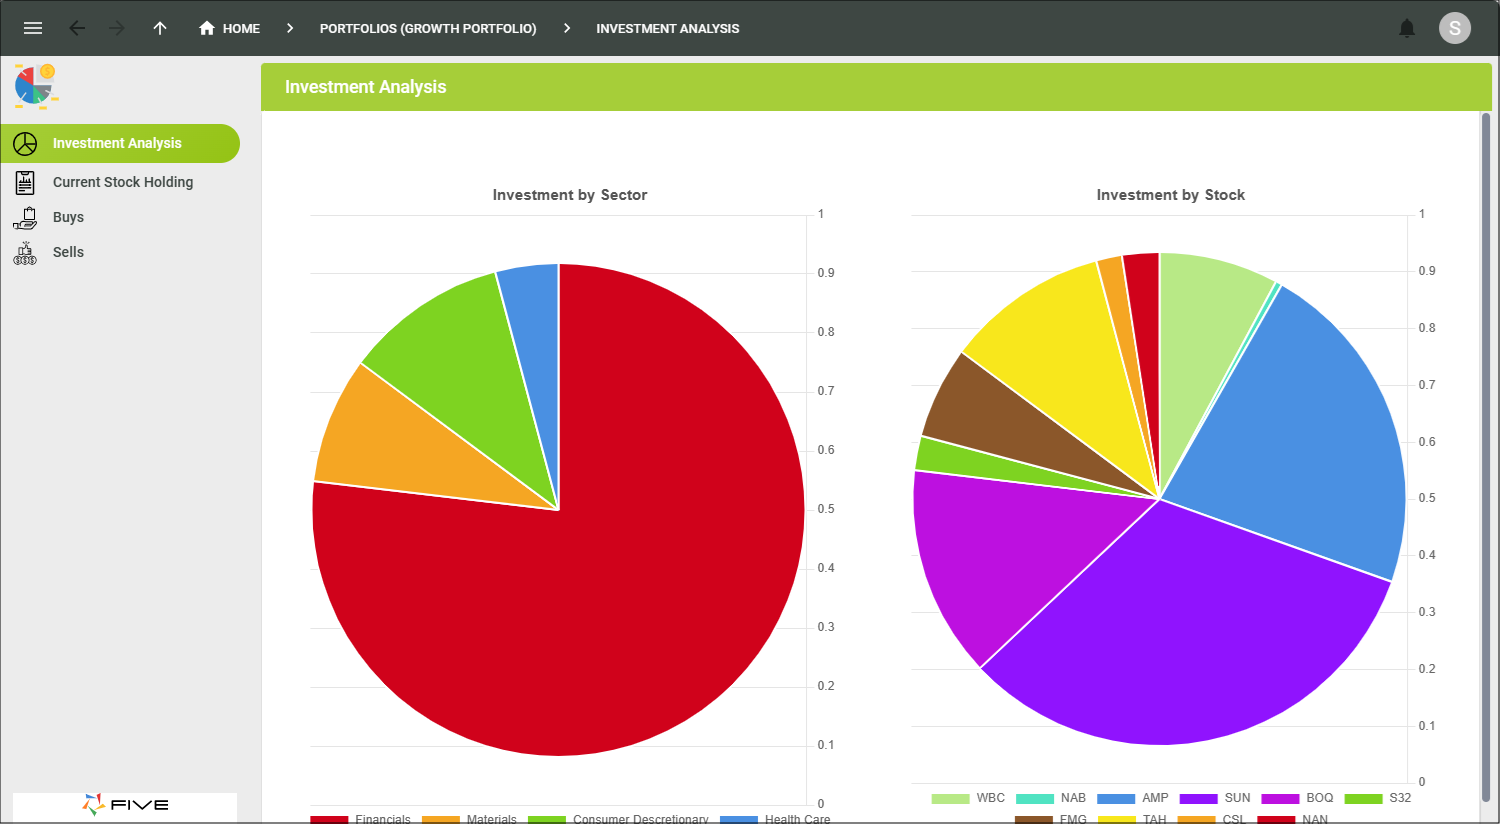
Figure 52 - Investment Analysis charts
4. Close the browser tab and return to Five.