Create a Report
Last updated 3/05/2024
Step 1: Add a Report
1. Click the Add Item button and give your report a title.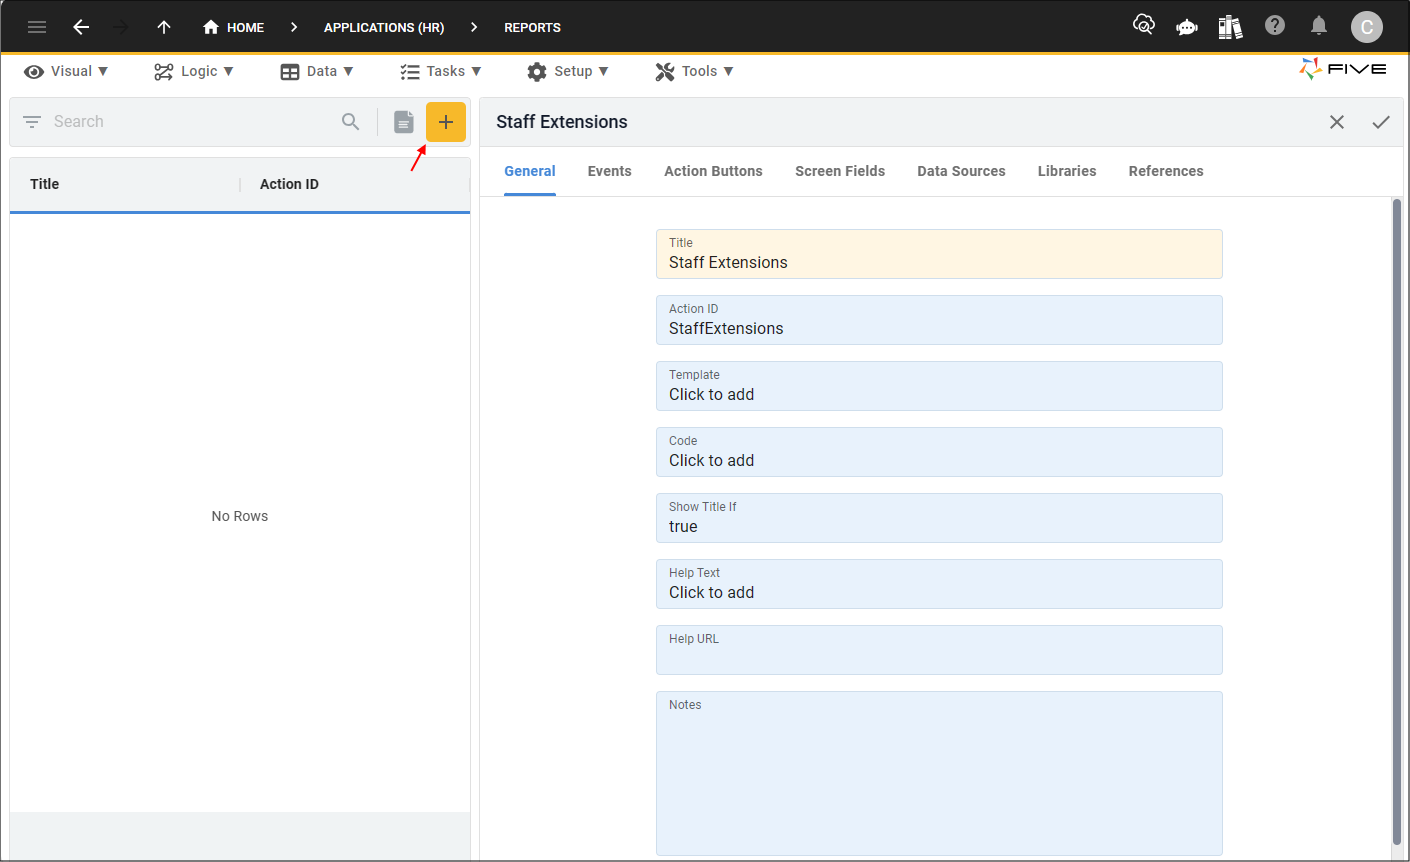
Step 2: Select a Data Source
A data source can be a saved table or query in Five, or an external connection that you have established in Five. All the fields and records you wish to display in your report must be in your data source. You can add multiple data sources and they will all be available to use in your report.
1. Click the Data Sources tab.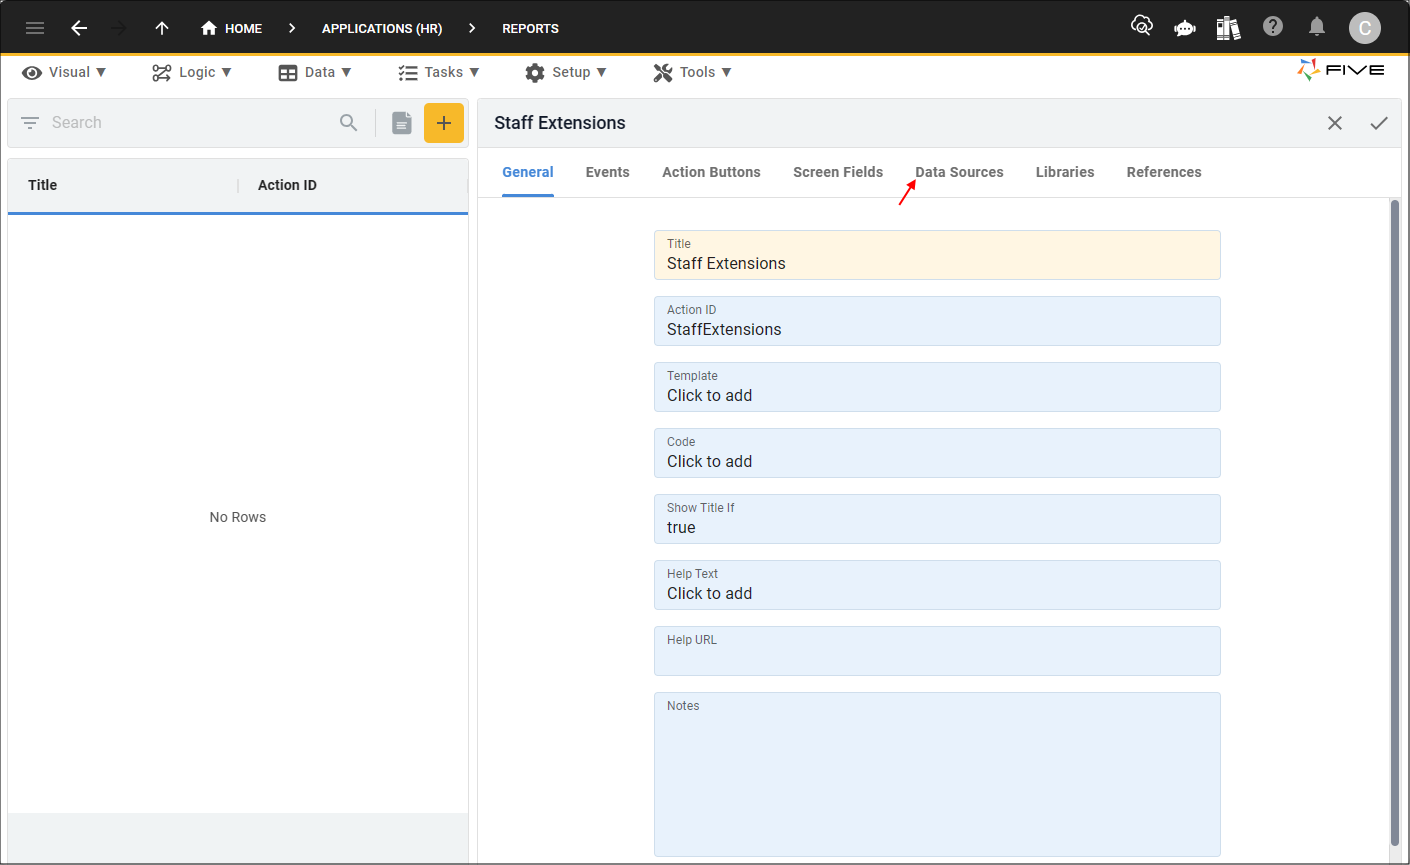
2. Click the Add Data Sources button.
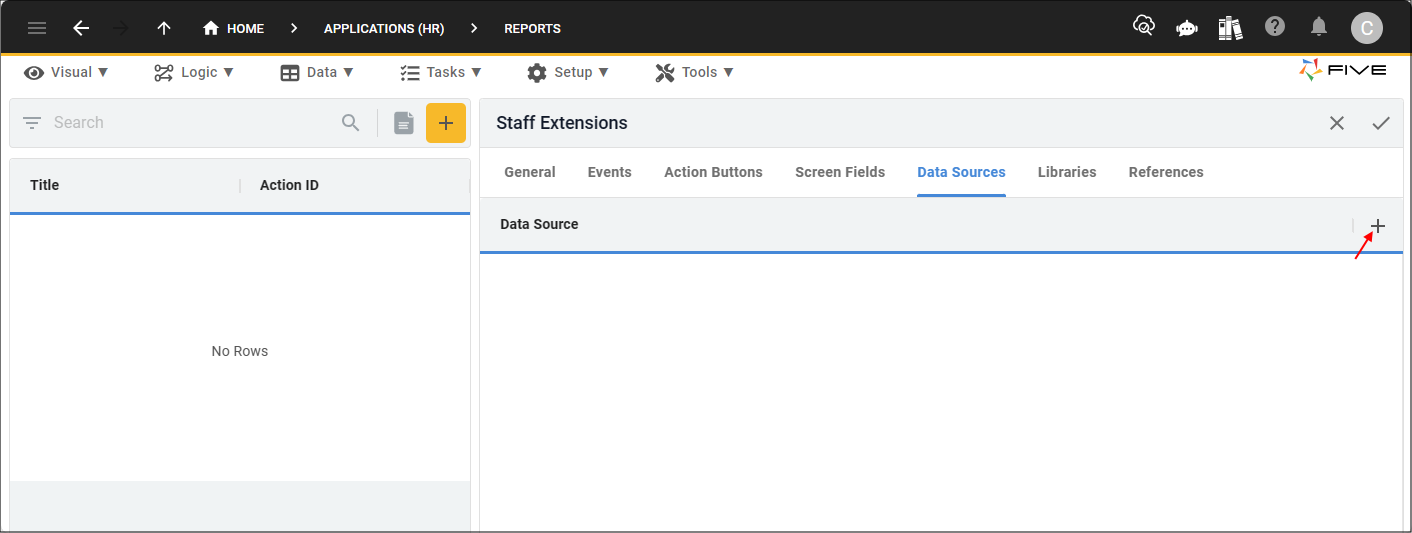
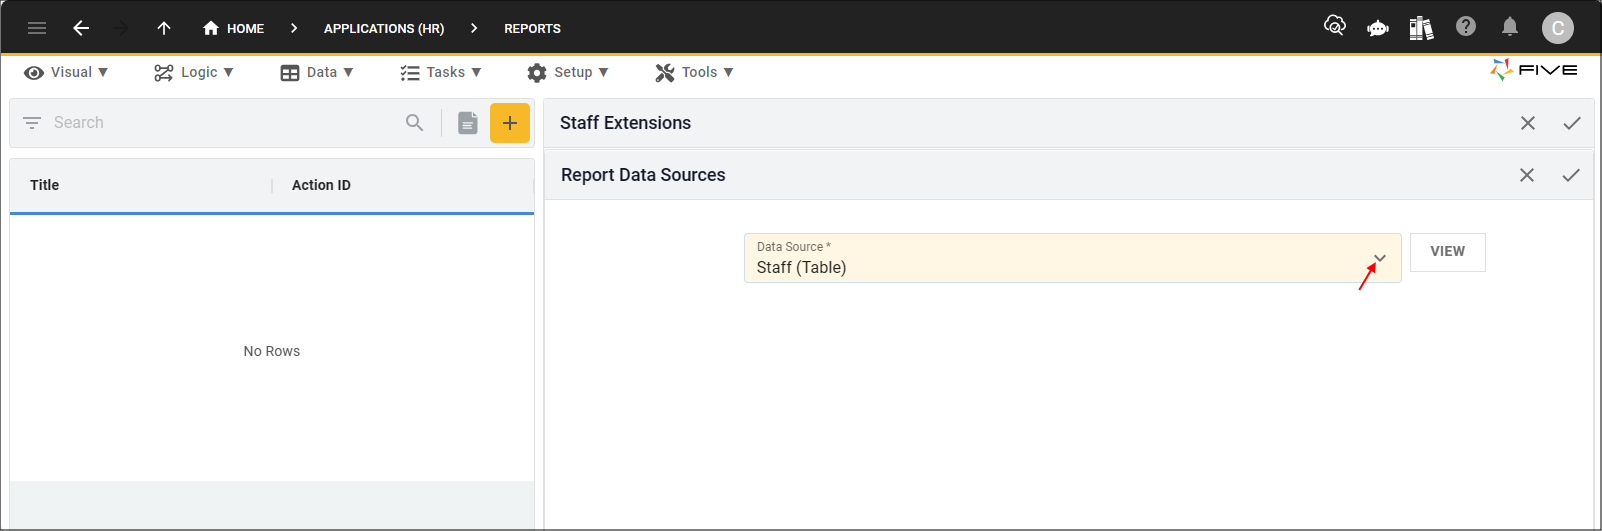
3. Select a data source.
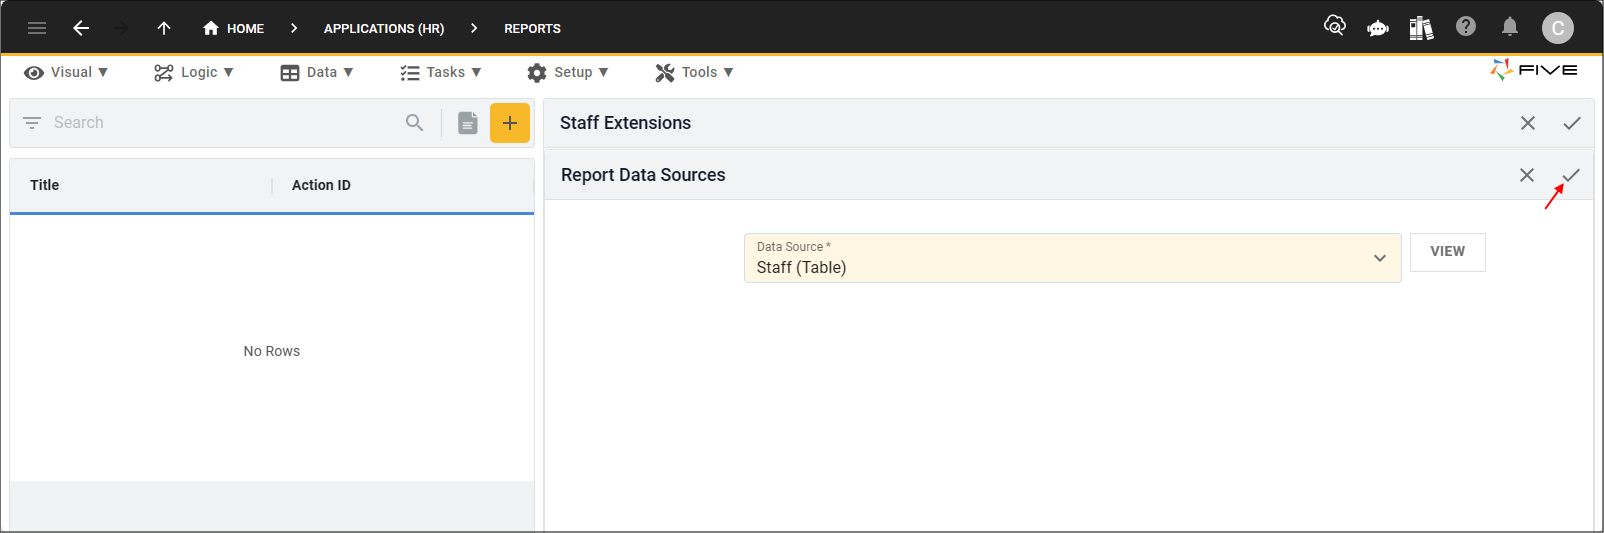
4. Click the Save button in the form app bar.
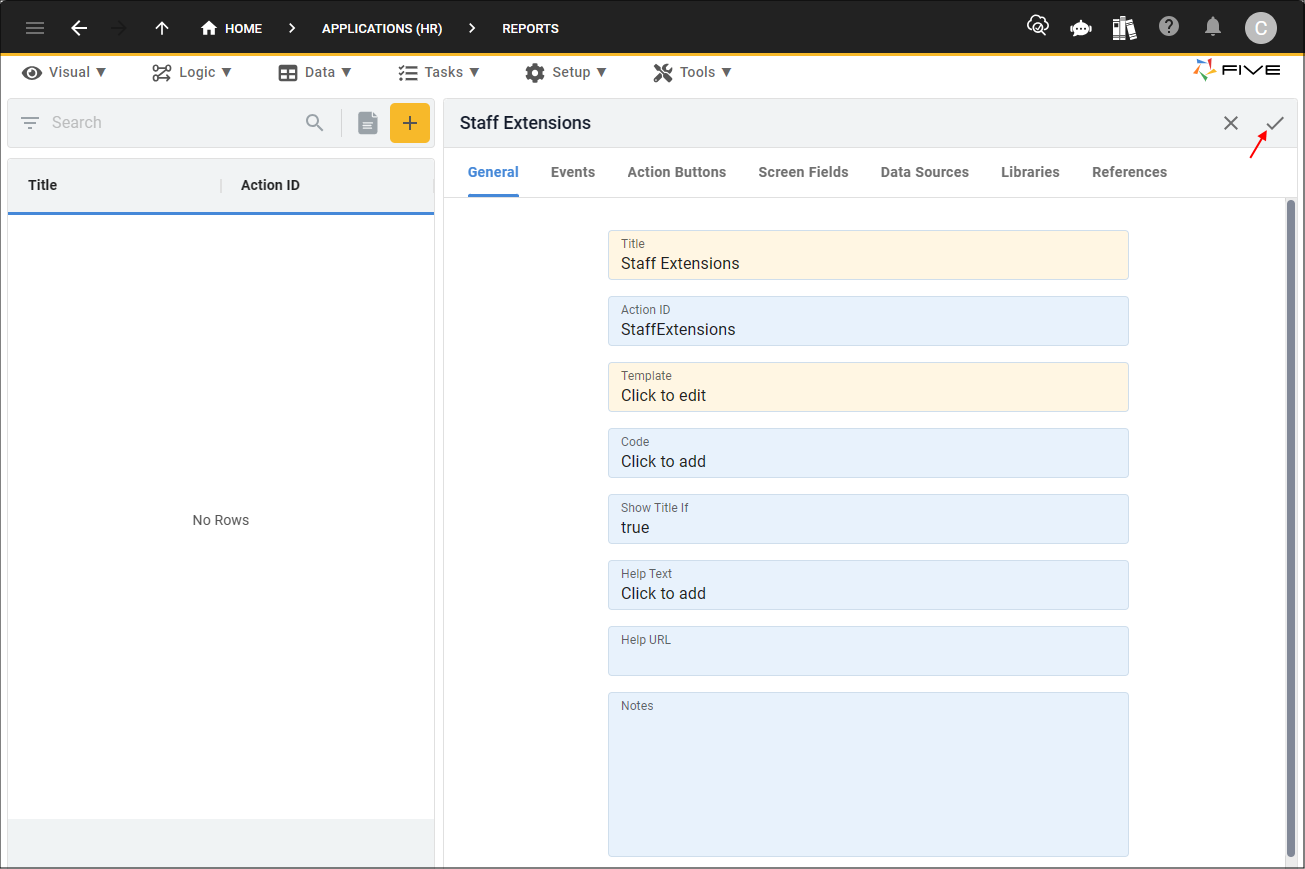
Step 3: Open the Template to Design Your Report
1. Click the General tab.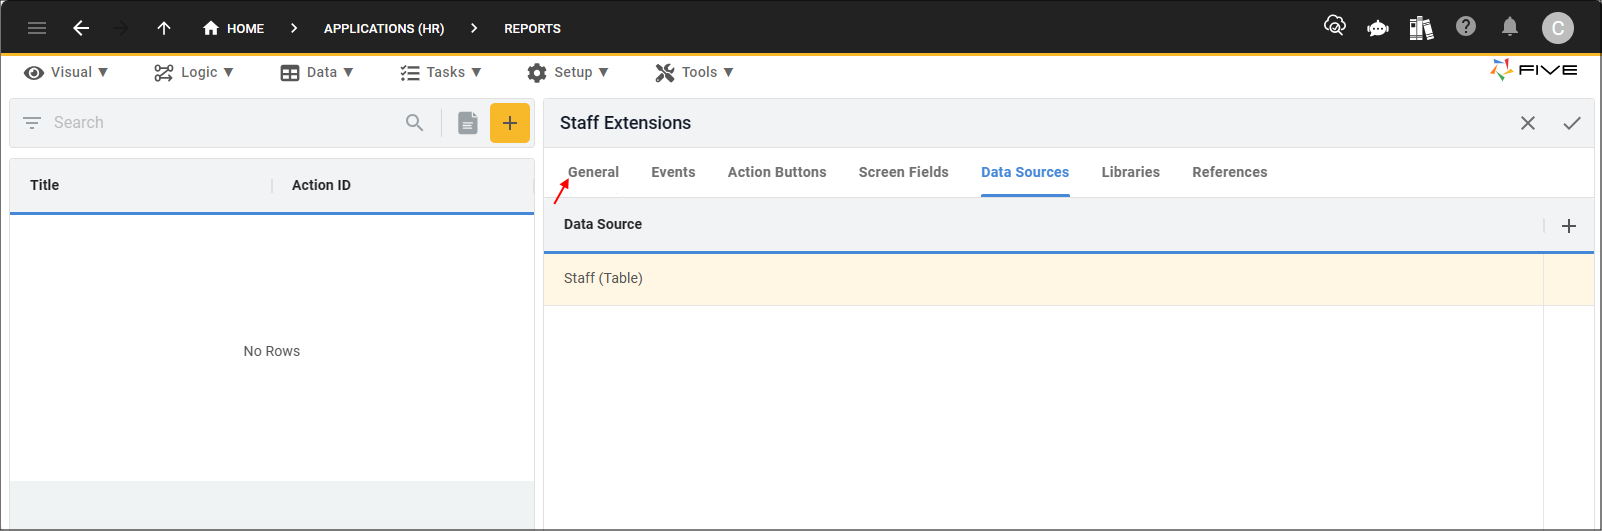
2. Click in the Template field.

Step 4: Create the Report
The template is used to design your report. It has a ribbon that holds tools that are common to most text editors which can be used to design your report.
Add a Header
1. Click the Header tool.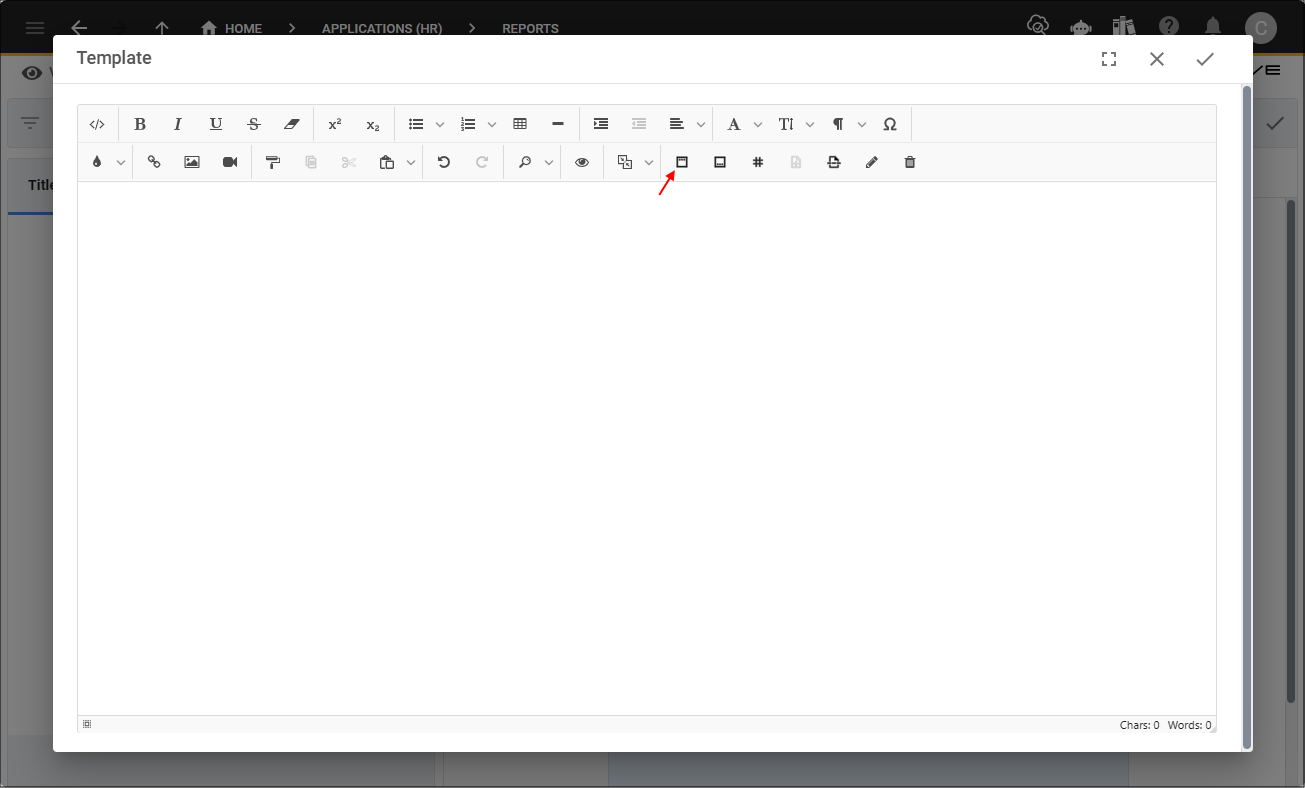
The Header dialog window enables you to repeat the number of times you want to add the header.
- None - will only show the header on the first page.
- Every - will make the header repeat on every page of your report.
The Height field is for you to adjust the height of your header.
2. Set the definitions for your header and click the Insert button.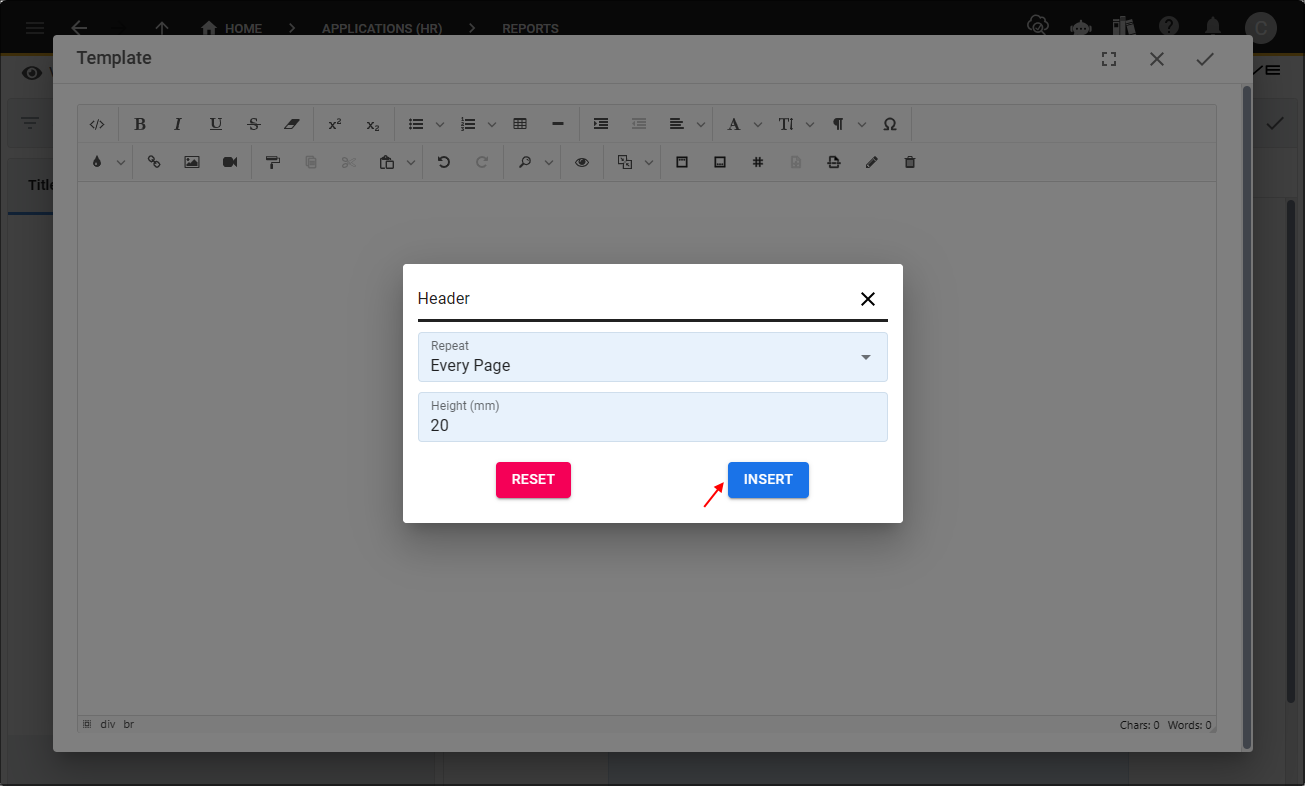
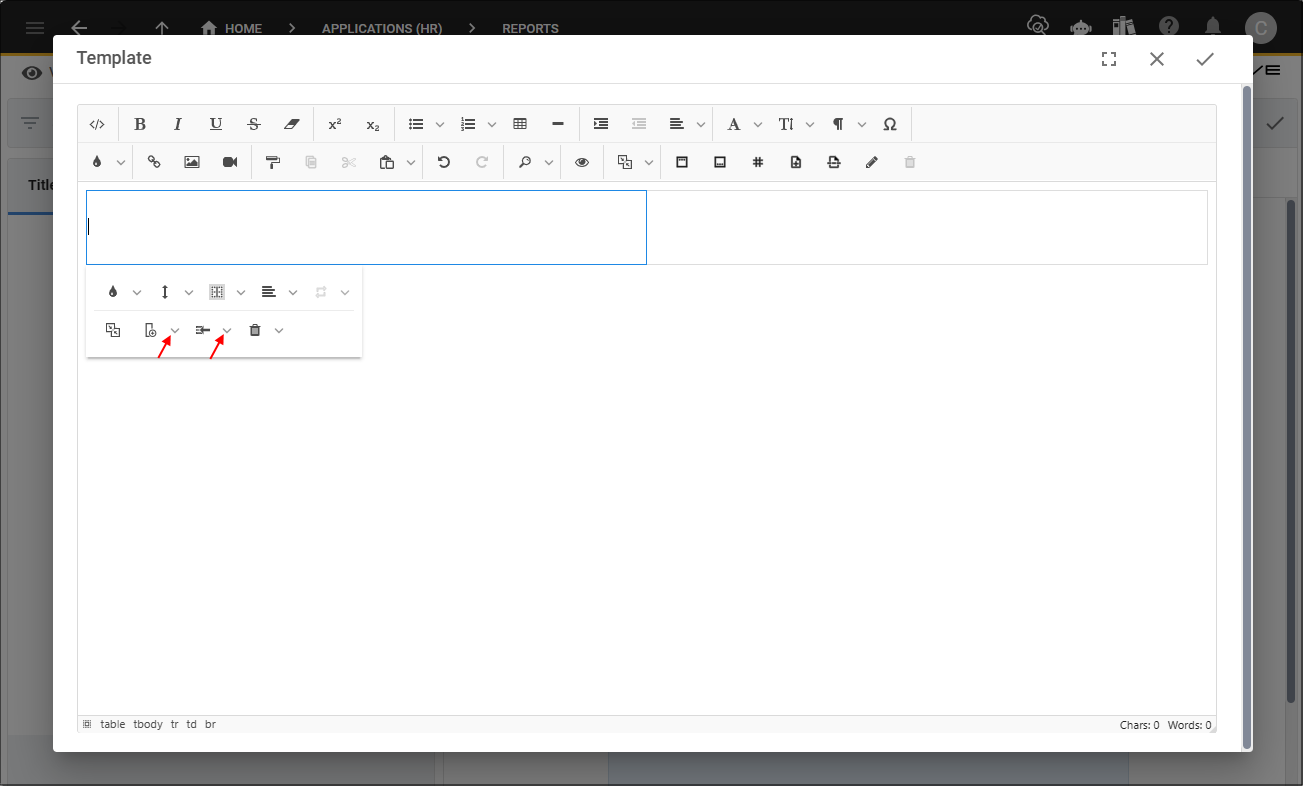
Click inside the header to have access to the popup ribbon. To have extra columns or rows in the header:
- Click the Add Column button and make a selection of before or after. Columns can be resized by dragging the divider.
- Click the Add Row button and make a selection of above or below.
Add Your Company Logo
Your company logo and small logo attached on the Instances form are automatically available in the Tags dropdown. For this example, the logo will be added to one of the columns in the header.
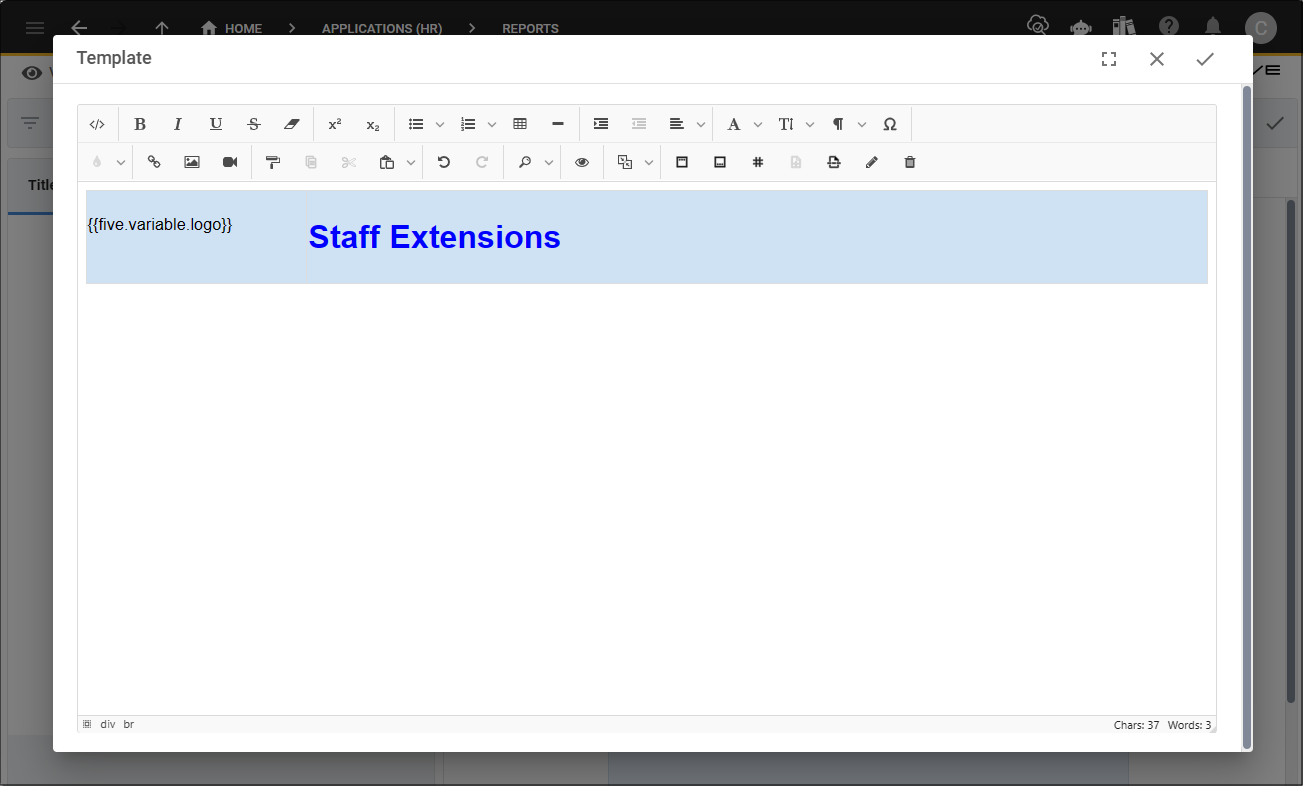
3. Postioned in a cell, select Logo in the Tags dropdown.Add a Heading
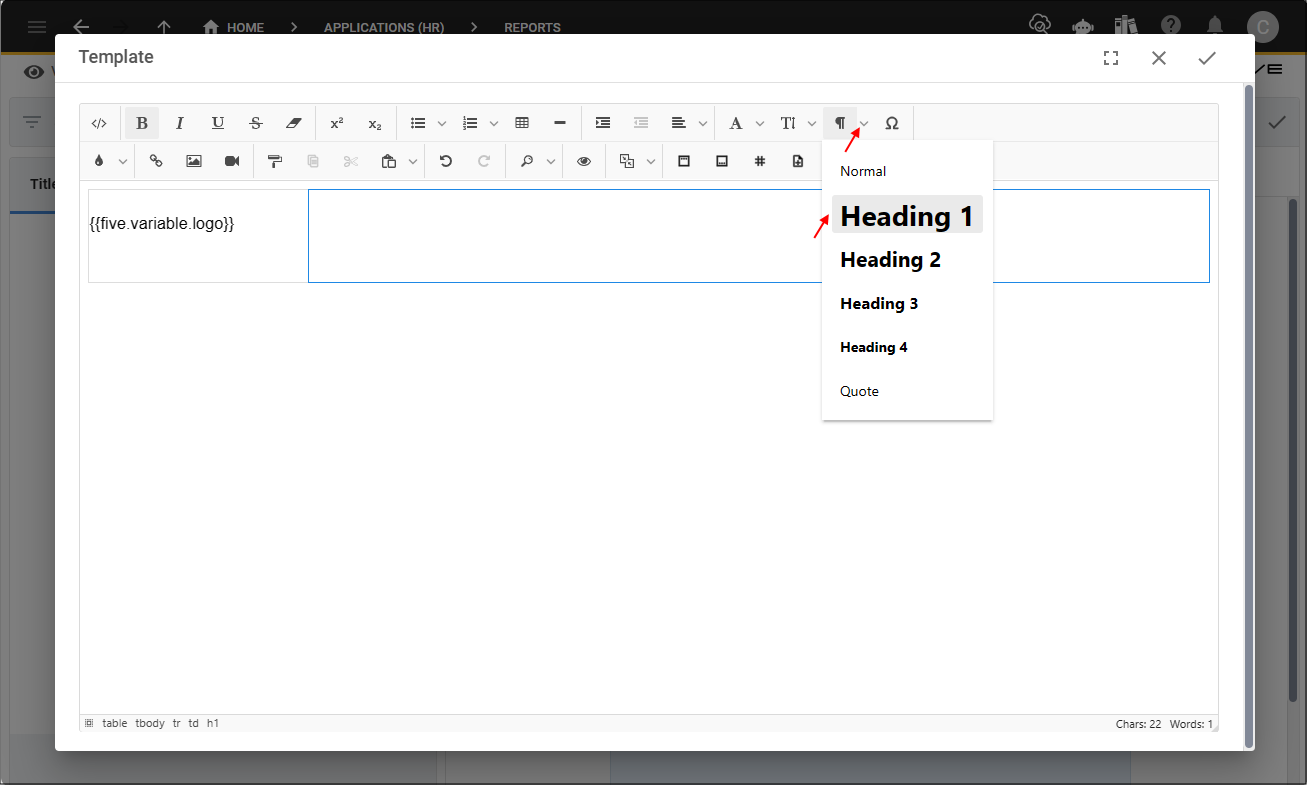
4. In a cell, type and format your heading.
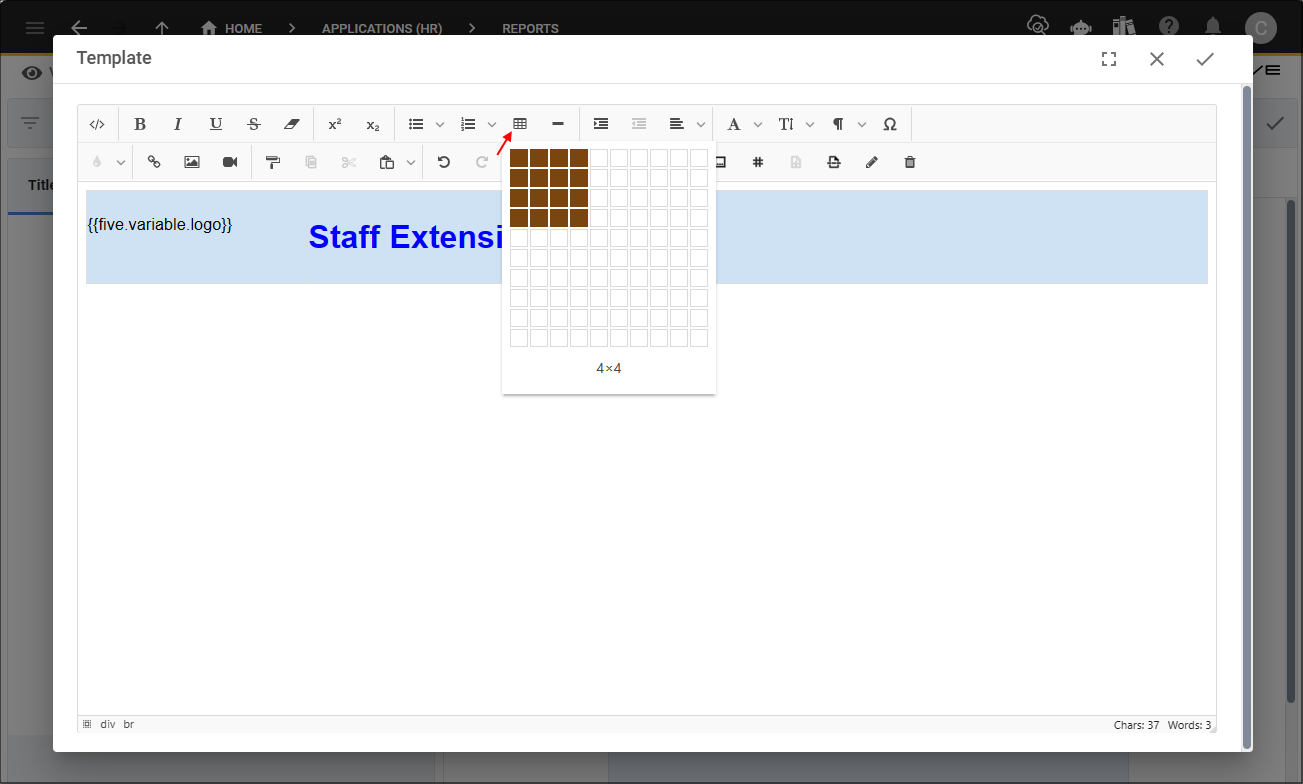
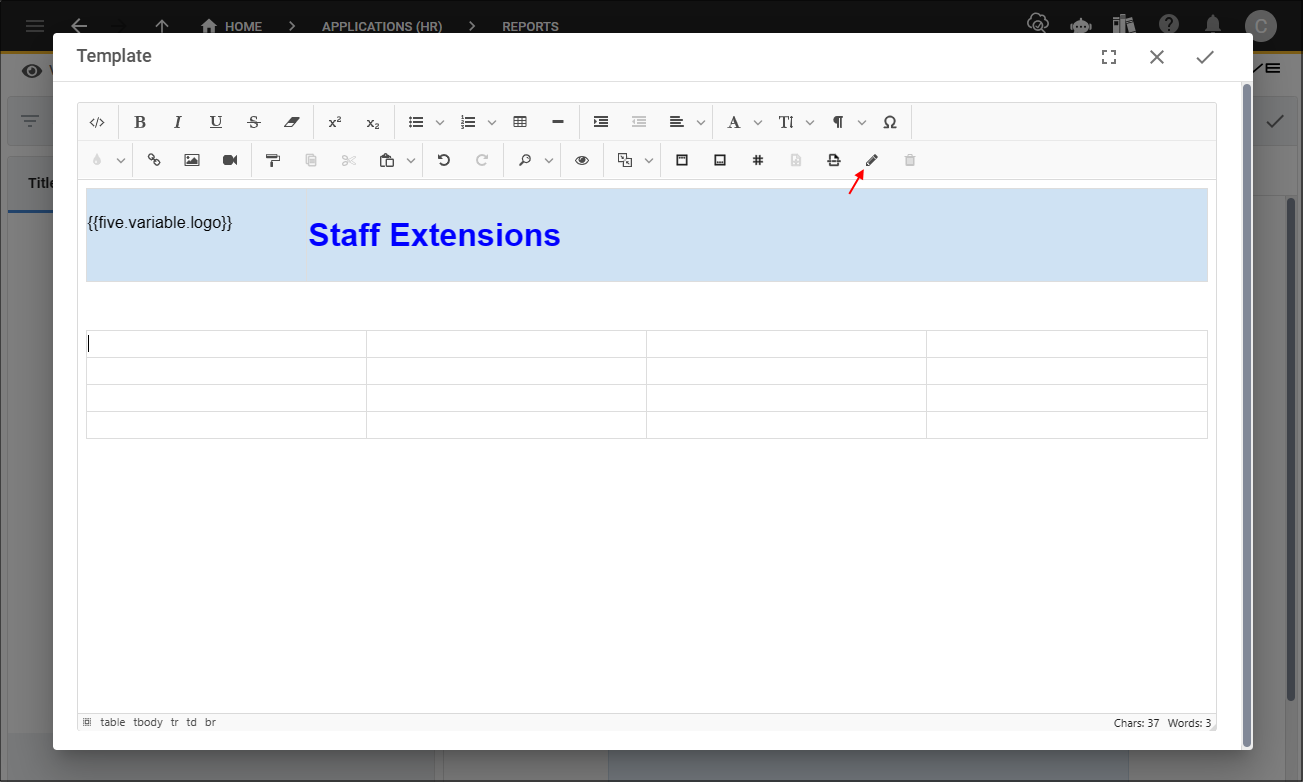
Add a Table
Once your table is added, you can then use the Insert Fields tool to add captions and records.
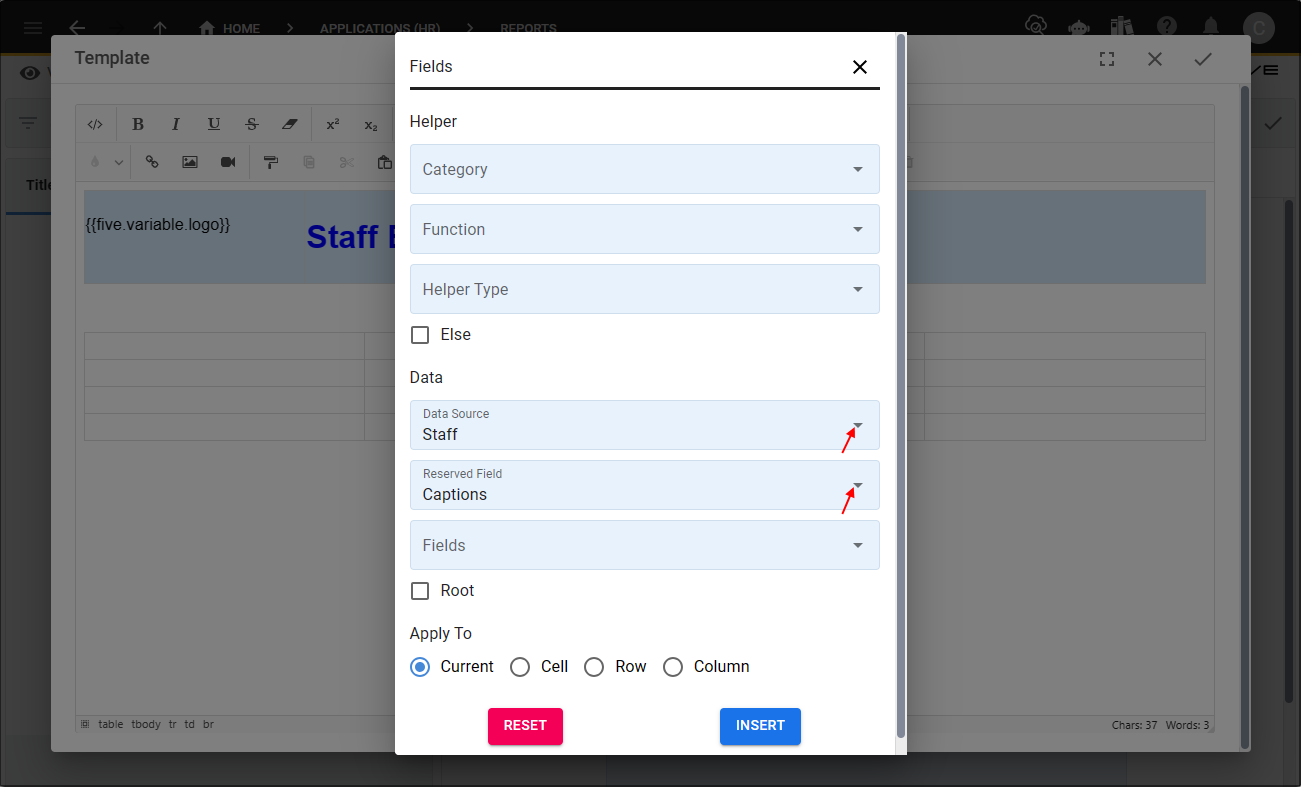
The Fields window will hold all the data sources that you selected outside the template and function helpers, whether they are inbuilt or custom written by you. While in the Fields window you can:
- Select the captions and fields from your data source.
- Use helper functions to format your returned data.
- Select how you want to apply the records in your table.
6. Click the Insert Fields tool.
7. Select your data source in the Data Source field.
8. Select Captions in the Reserved Field field.
9. Select all the fields you require from your data source in the Fields field.
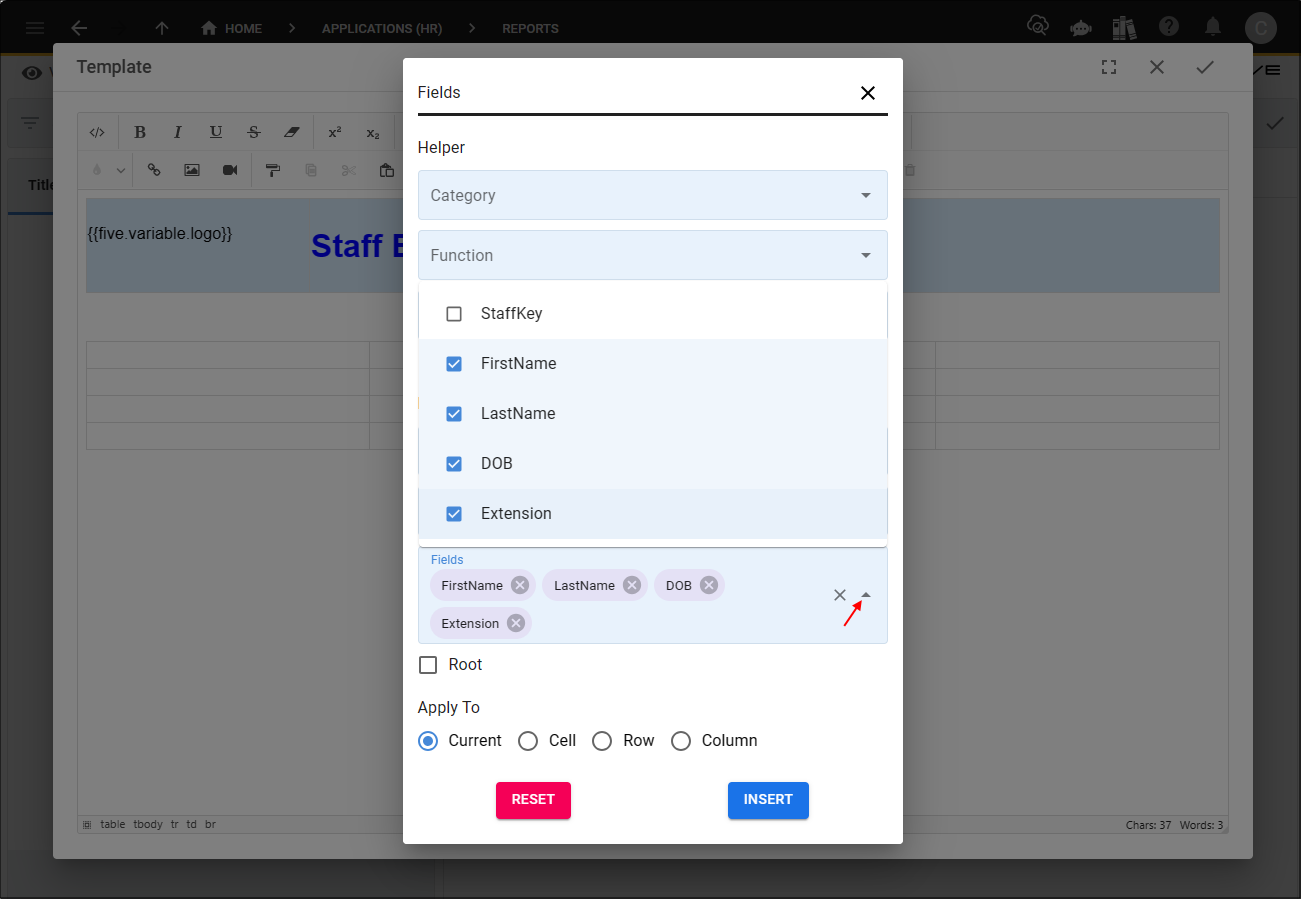
10. Apply to the row.
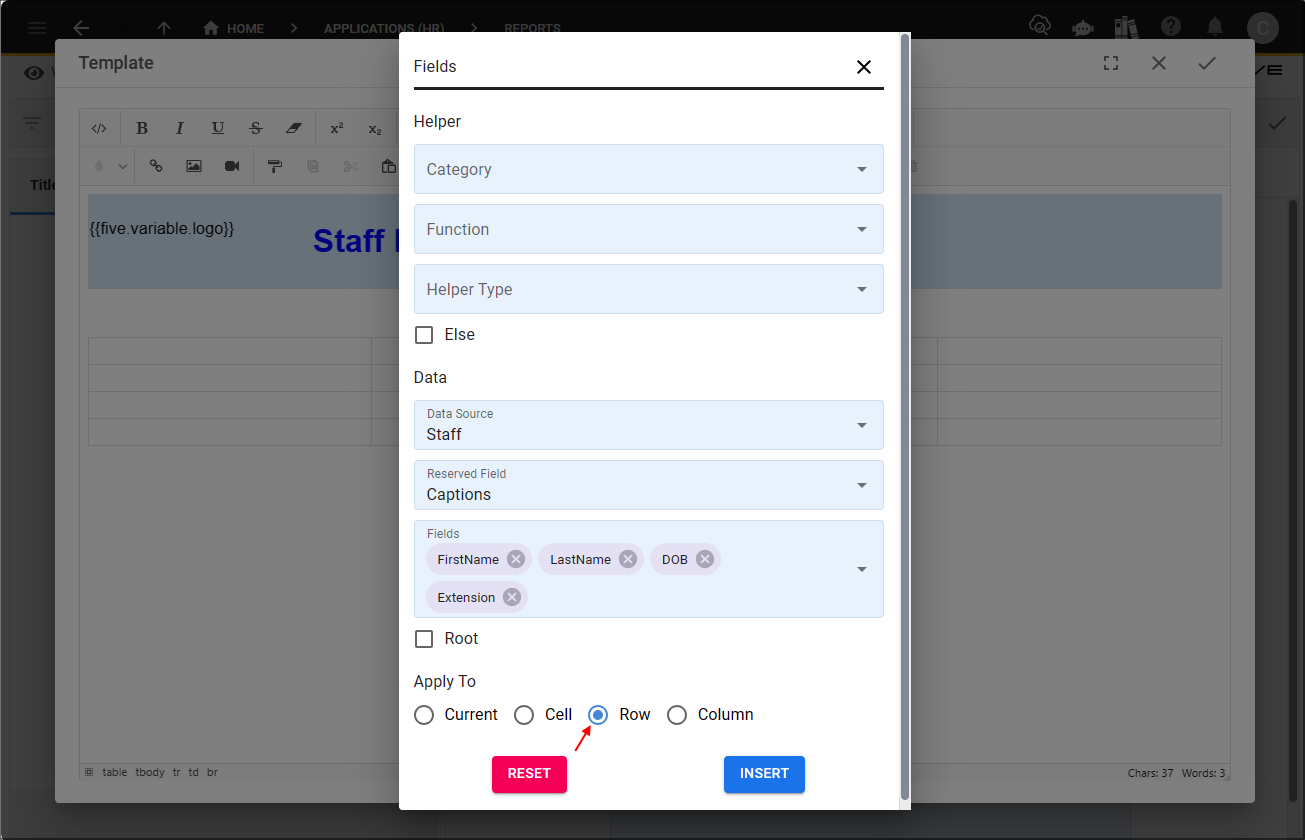
11. Click the Insert button.
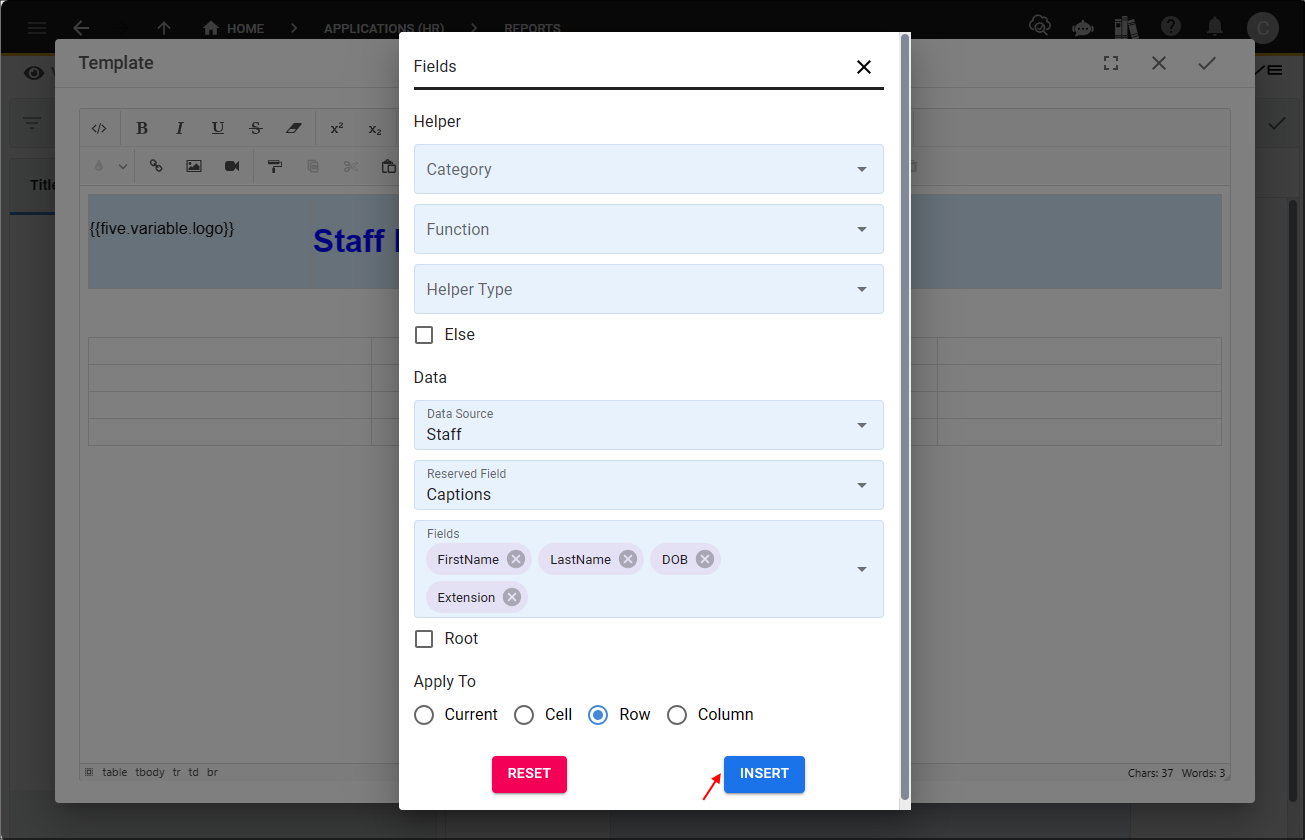
12. Click the Insert Fields tool again.
13. Select Built In in the Category field.
14. Select _Each in the Function field.
15. Select your data source in the Data Source field.
16. Select all the fields you require from your data source in the Fields field.
17. Apply to the row and click the Insert button.
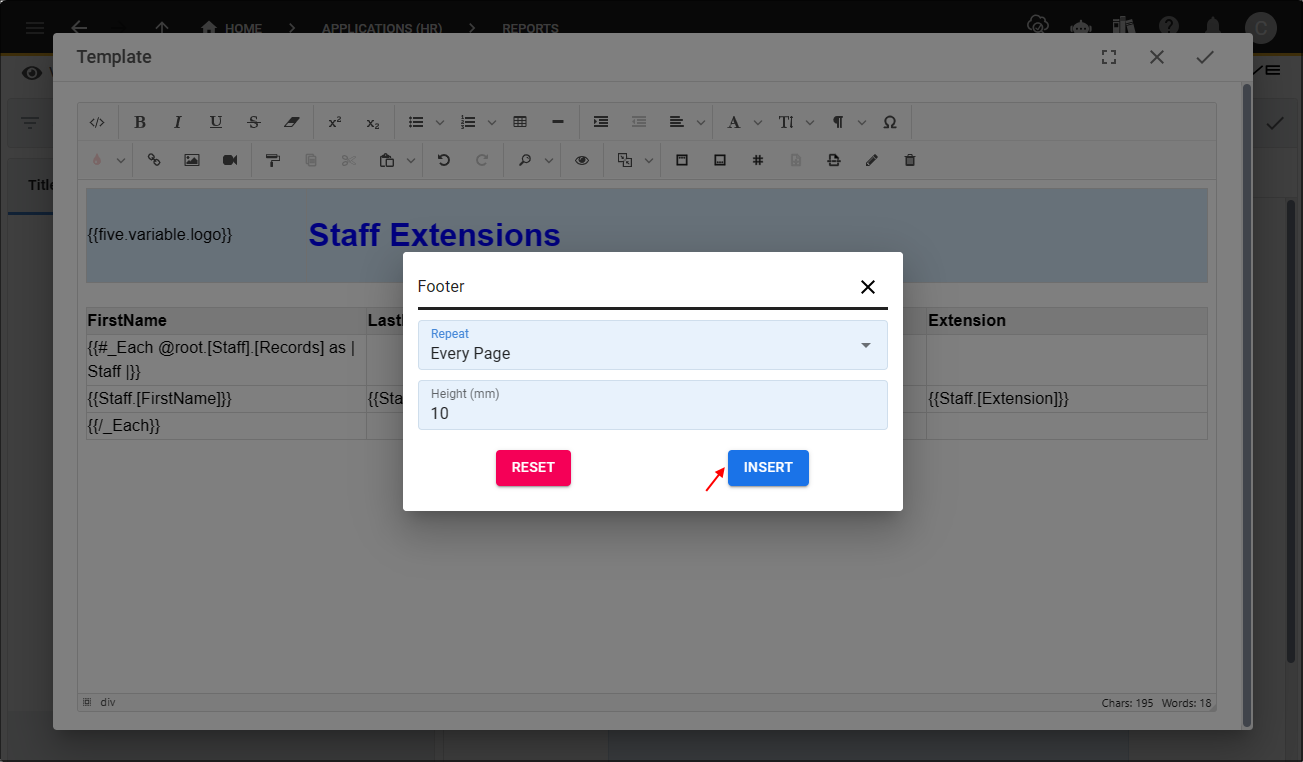
Add a Footer
18. Click the Footer tool.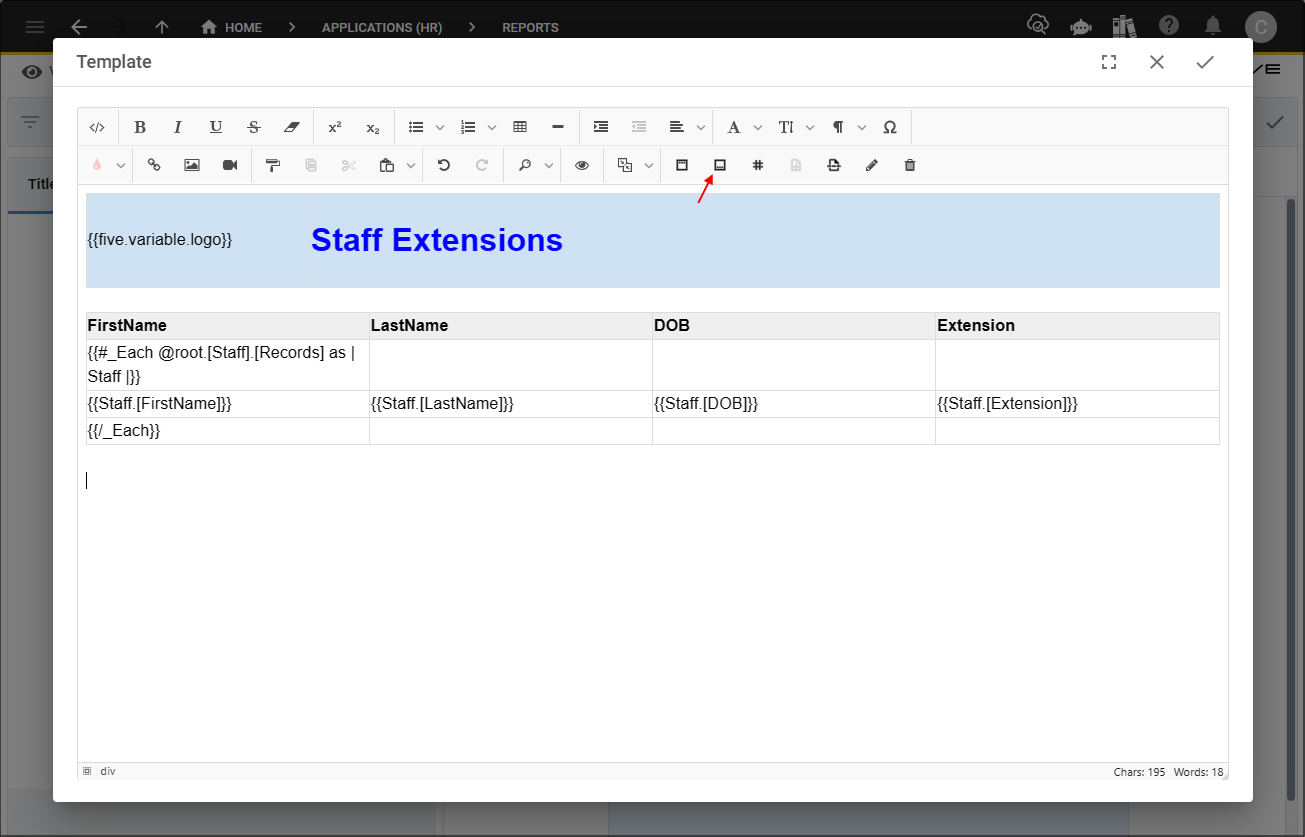
19. Set the definitions for your footer and click the Insert button.
Add Page Numbers
20. Click the Insert Page Number tool.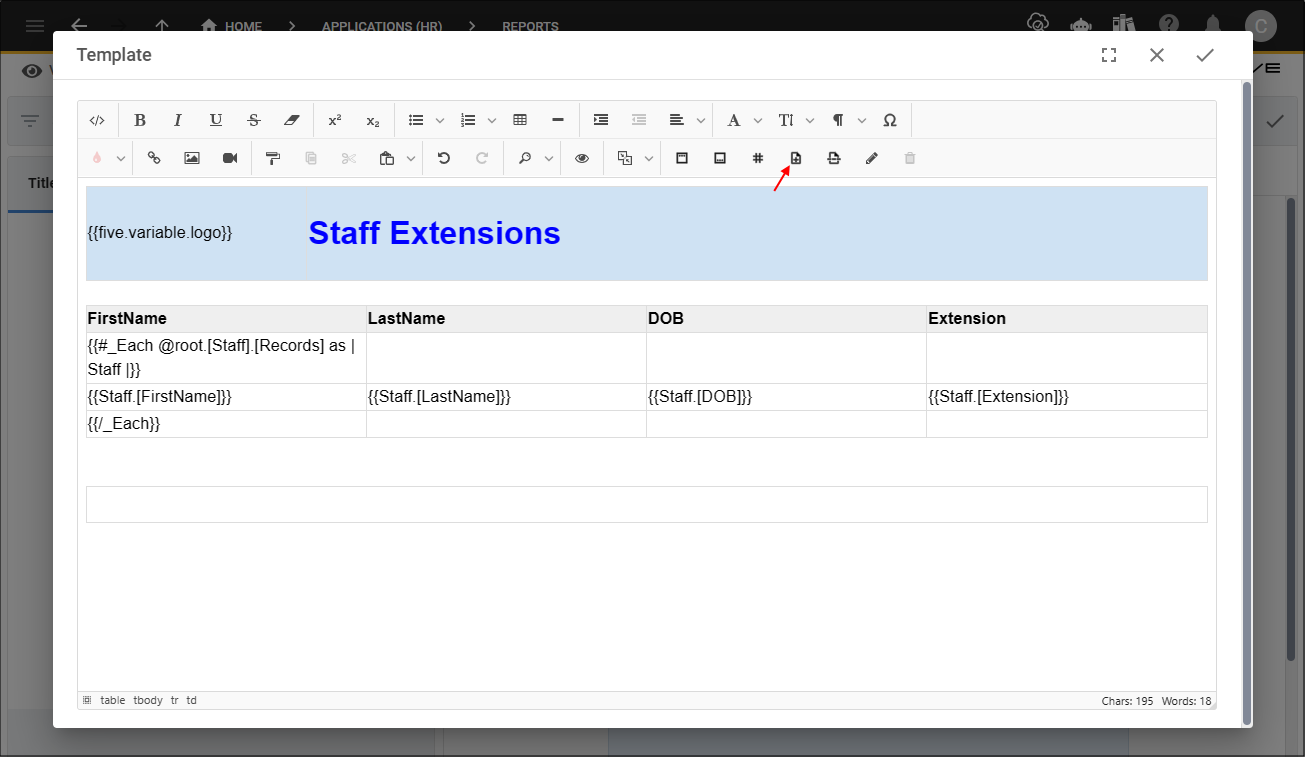
21. Click the Insert button.

Step 5: Save a Report
1. Click the Save button in the editor app bar.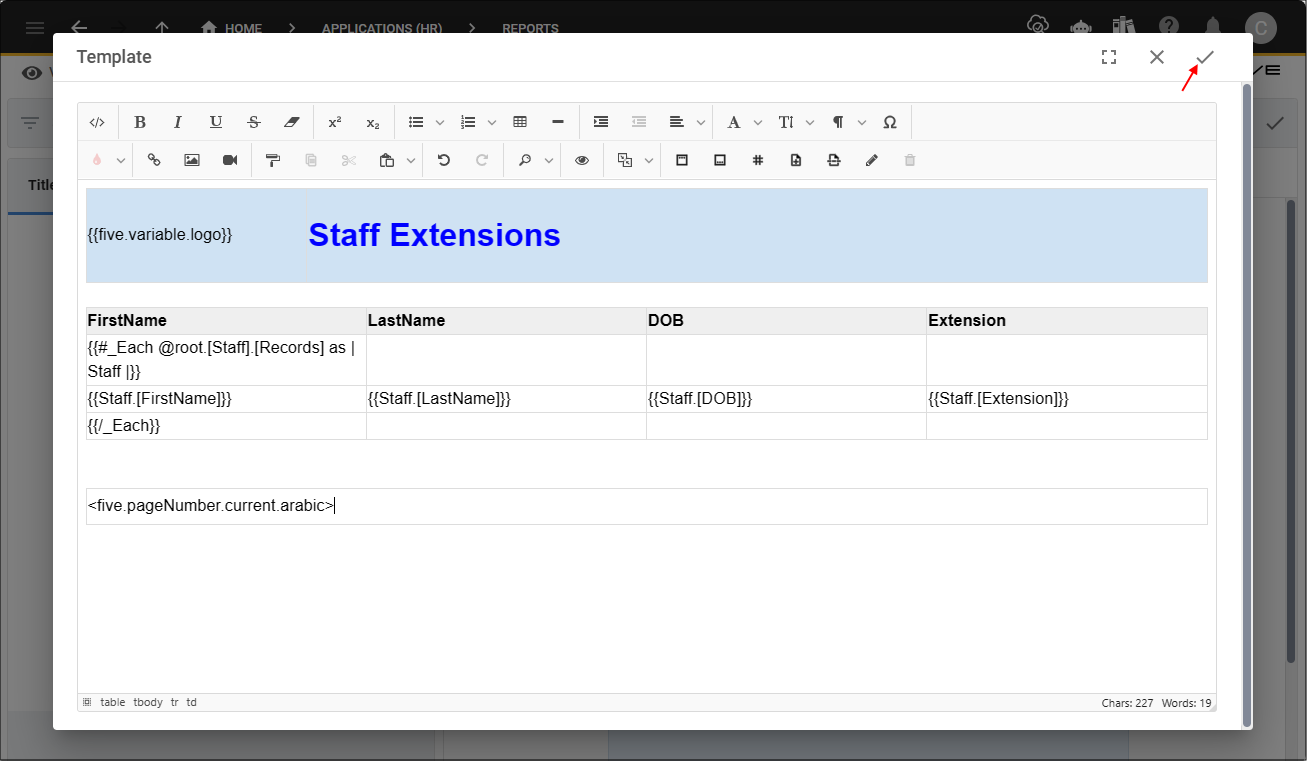
2. Click the Save button in the form app bar.
Download a Report
In Windows, once the report has generated in your application, you can click the Save button and the report will be downloaded to your local computer in a PDF file.
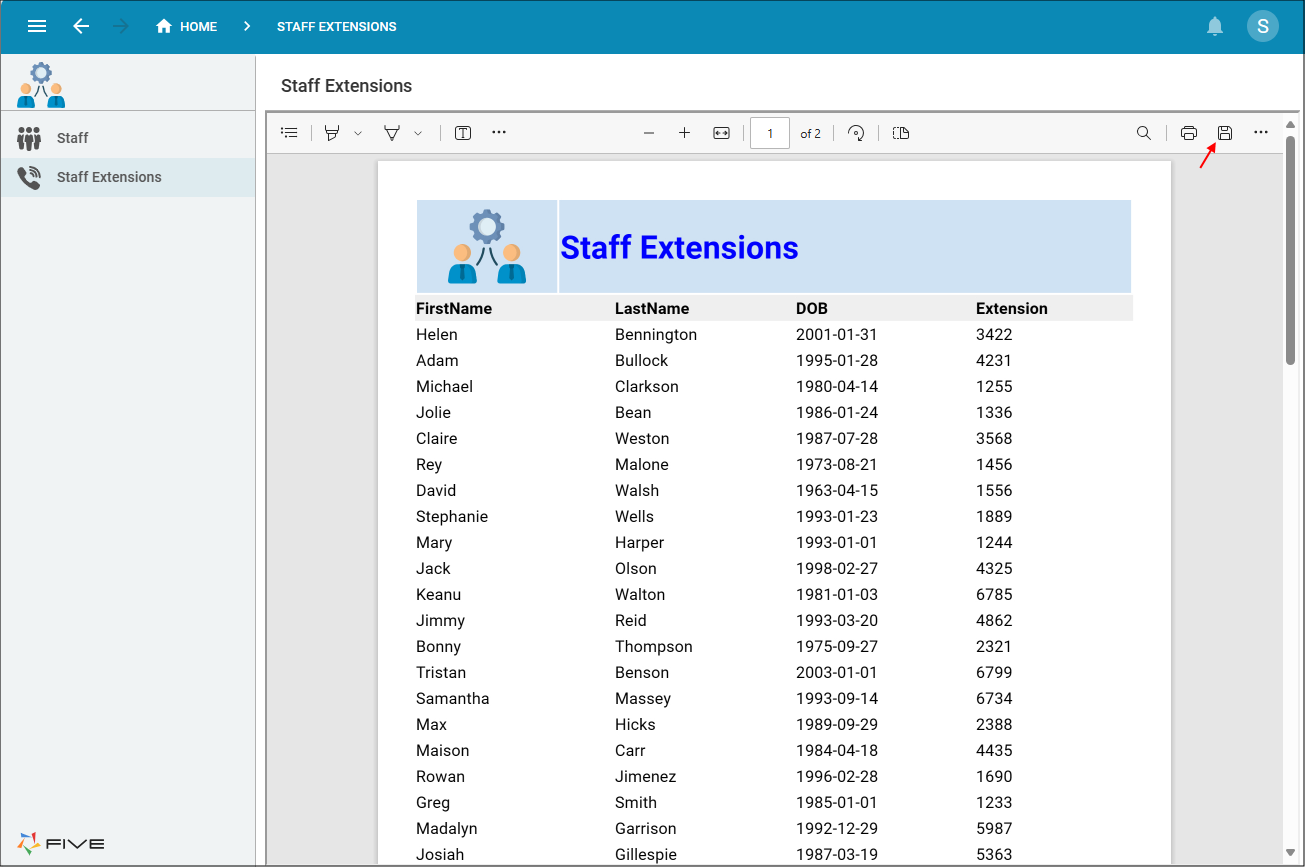
In Mac, once the report has generated in your application, you can click the Download button and the report will be downloaded to your local computer in a PDF file.
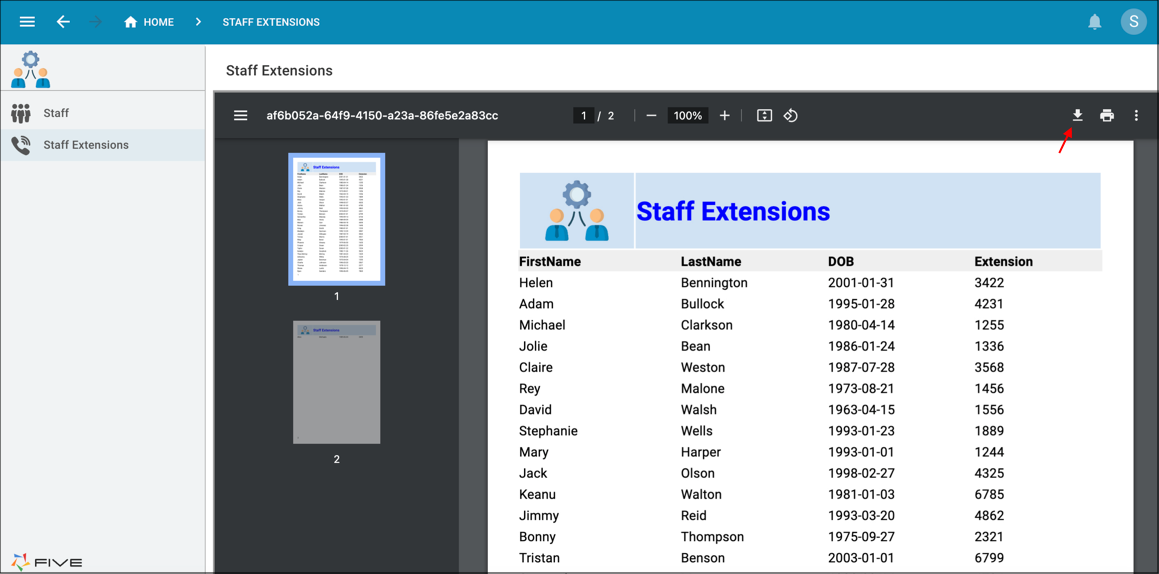
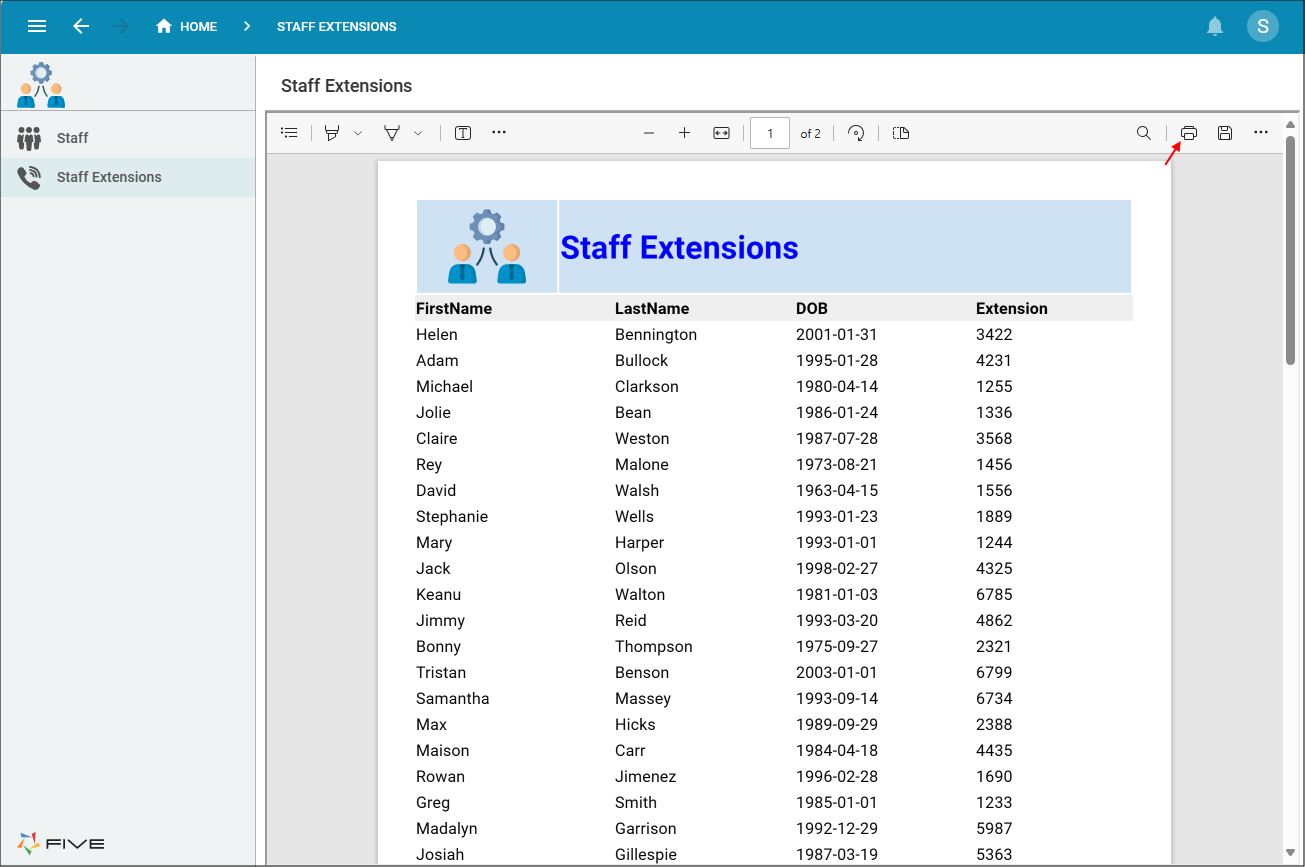
Print a Report
Once the report has generated in your application, you can click the Print button.