Introduction
Last updated 30/04/2024
Five's reports are a way to format and summarize your data to be viewed easily. For example, you can create a simple report of phone extensions for all employees in your company or a summary report on all sale distributions across different countries. The data for your reports can come from any of your data sources.
Five's Data Sources- Tables
- Queries
- Connections
Creating Reports
You can create quick, simple reports by just selecting fields from your data source. Or you can make more complex reports by creating your own helper functions and interacting with external data sources.
Five's editor enables you to design and format your report by point and click, or you have full flexibility with your design by using the advanced side of the editor if you have HTML and CSS knowledge.
Your report simply gets integrated into your application by creating a menu item, an action button, or generating it in the backend and attaching to an email.
This documentation is designed to teach you how you can create your reports in Five. If you have never used Five's reports before, it is highly recommended that you refer to our New to Five's Reports chapter.
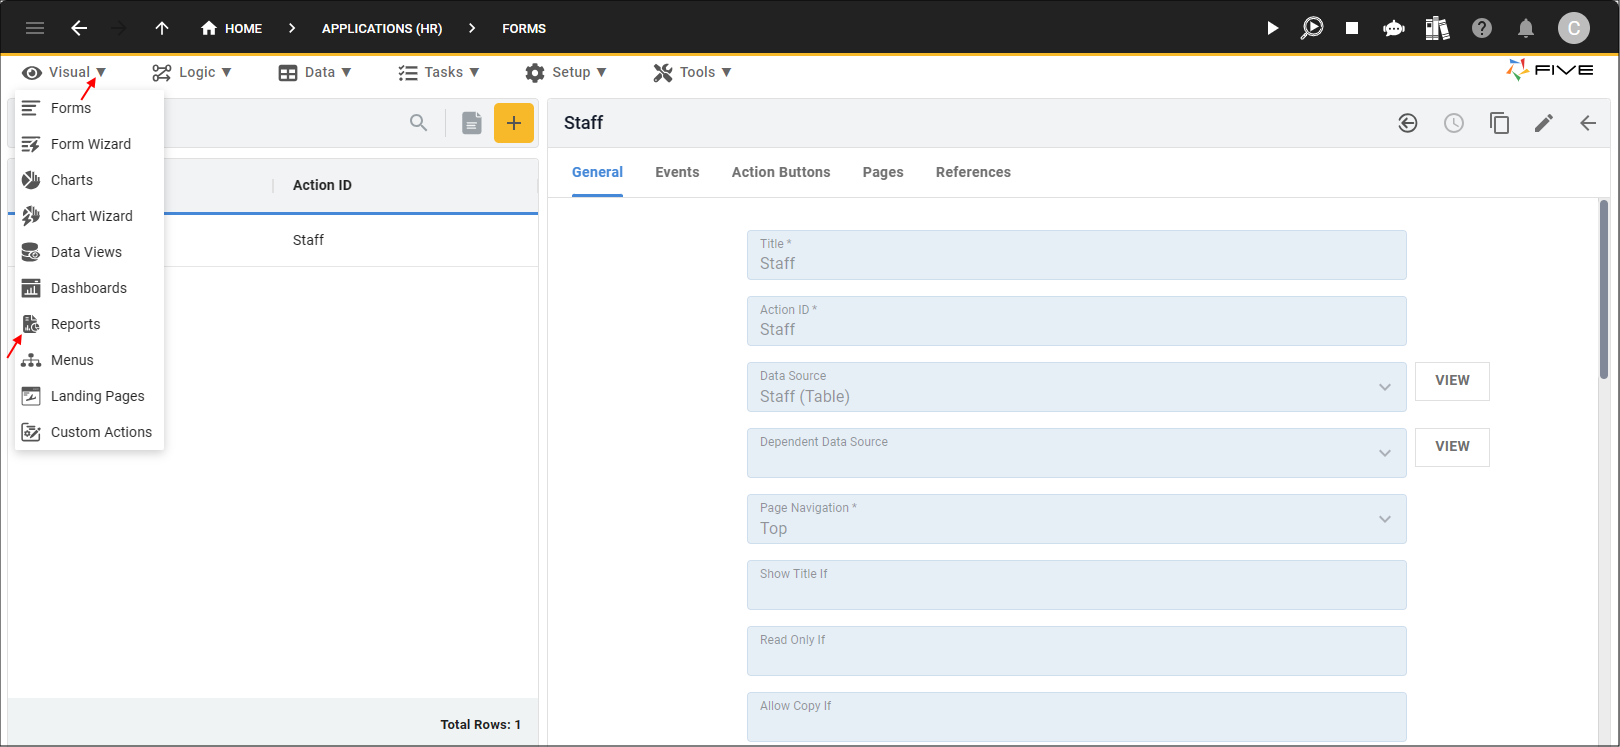
Navigating to Reports
1. Select Visual in the menu and Reports in the sub-menu.